Fig. 6
Download original image
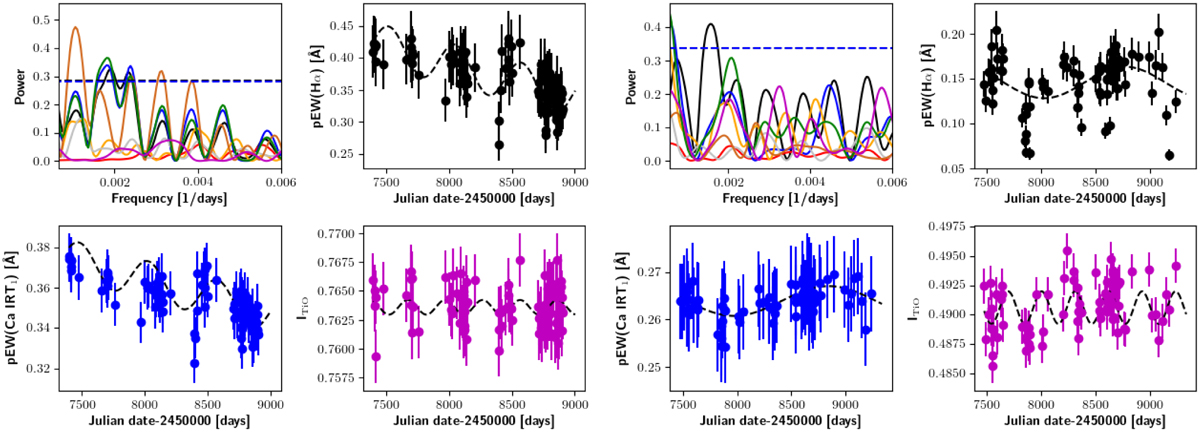
Same as in Fig. 5. GLS and time series of J05415+534/HD 233153 (left) and J18346+401/LP 229-017 (right). We note that for J05415+534/HD 233153, a linear trend was found as well, which we include in the sine fit for pEW(Hα) and pEW(Ca II IRT1). We further note that for J18346+401/LP 229-017, the highest peak of pEW(Hα) in the GLS is at about twice the frequency as for the other chromospheric indicators that triggered the cycle detection. We therefore used half the frequency for the sine fit of pEW(Hα) as well.
Current usage metrics show cumulative count of Article Views (full-text article views including HTML views, PDF and ePub downloads, according to the available data) and Abstracts Views on Vision4Press platform.
Data correspond to usage on the plateform after 2015. The current usage metrics is available 48-96 hours after online publication and is updated daily on week days.
Initial download of the metrics may take a while.