Fig. 5
Download original image
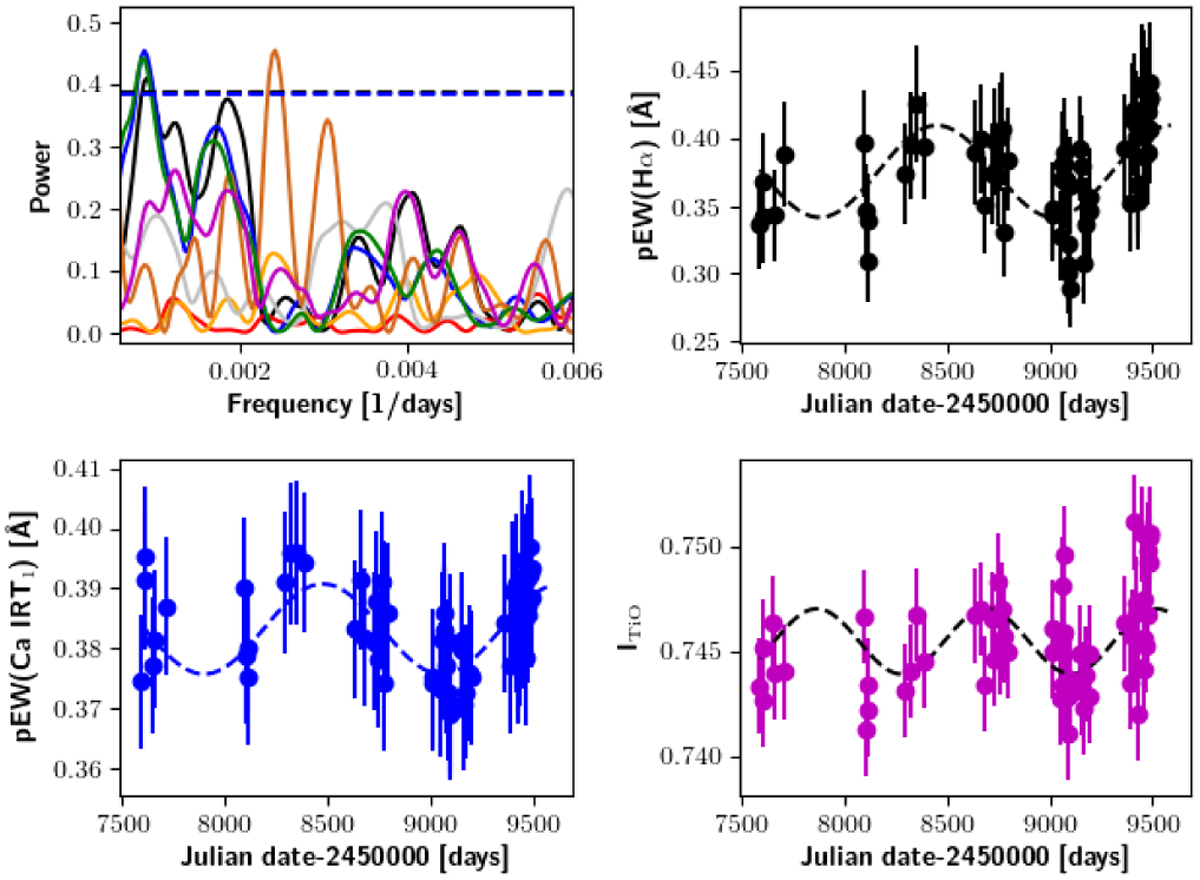
GLS and time series of J22330+093/BD+08 4887. We show the GLS (left, top) with pEW(Hα) in black, pEW(Ca II IRT1) in blue, pEW(Ca II IRT2) in green, the TiO index in magenta, RV in yellow, dLw in grey, CRX in orange, and the window function in red. The dashed blue line indicates FAP=0.001 for the pEW(Ca II IRT1) data. Additionally, we show the time series for pEW(Hα) (right, top), for pEW(Ca II IRT1) (left, bottom), and the TiO index (right, bottom). The dashed black lines indicate the best sine fit for each indicator.
Current usage metrics show cumulative count of Article Views (full-text article views including HTML views, PDF and ePub downloads, according to the available data) and Abstracts Views on Vision4Press platform.
Data correspond to usage on the plateform after 2015. The current usage metrics is available 48-96 hours after online publication and is updated daily on week days.
Initial download of the metrics may take a while.