Open Access
Fig. 2
Download original image
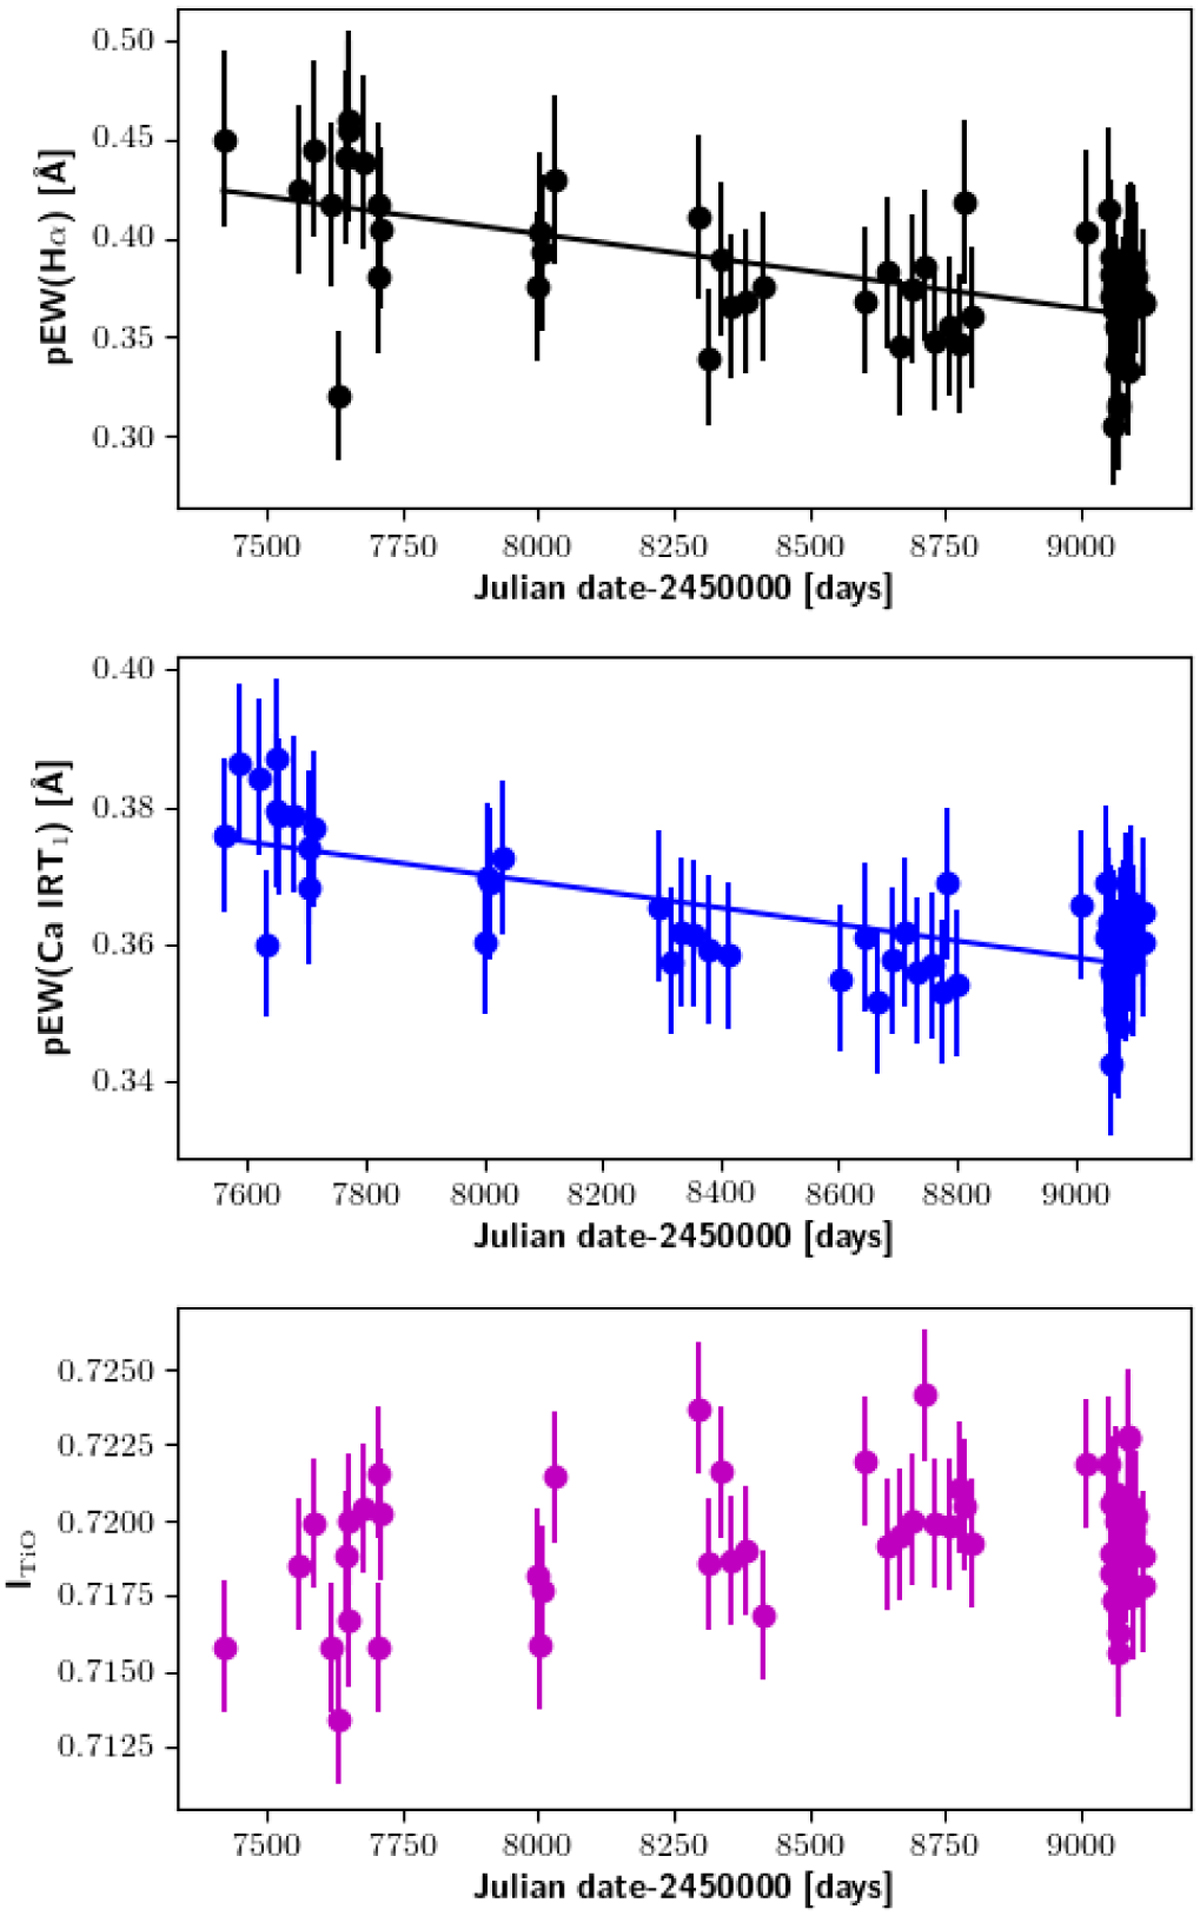
Time series of J23245+578/BD+57 2735. We show the pEW(Hα) (top, black dots), pEW(Ca II IRT1 ) (middle, blue dots), and ITiO (bottom, magenta dots). Additionally, the best linear fit is indicated as the solid line. The error bars are not statistical, but determined by the activity jitter of inactive stars.
Current usage metrics show cumulative count of Article Views (full-text article views including HTML views, PDF and ePub downloads, according to the available data) and Abstracts Views on Vision4Press platform.
Data correspond to usage on the plateform after 2015. The current usage metrics is available 48-96 hours after online publication and is updated daily on week days.
Initial download of the metrics may take a while.