Open Access
Fig. 8.
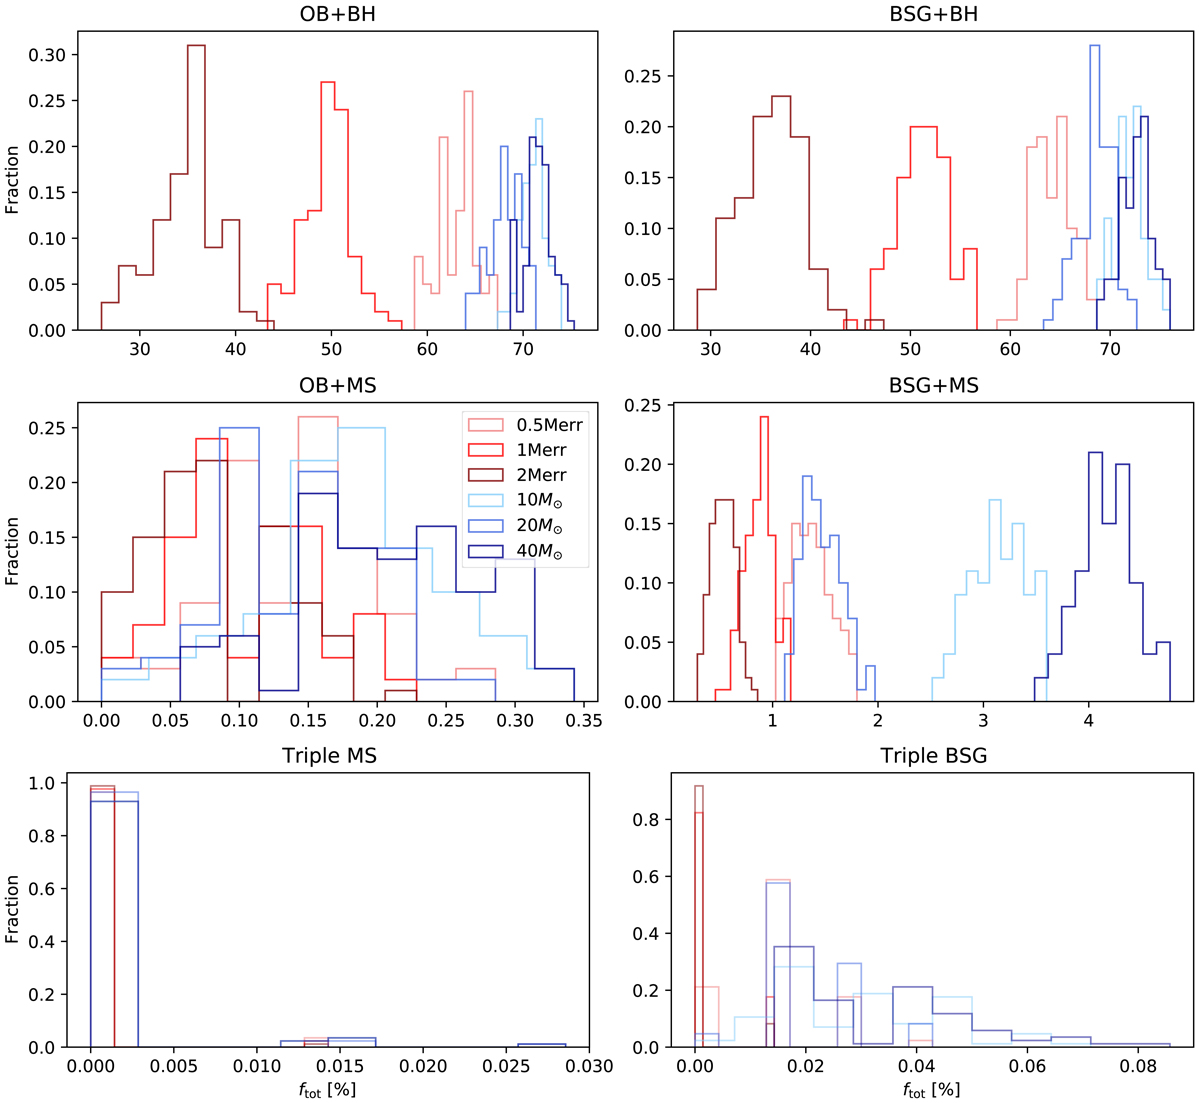
Download original image
Total fraction of identified systems when using the MS curves for single-degenerate binaries with a BH (top row), non-degenerate binaries (middle row), and triples from the SMASH+ (bottom row). Left and right panels are for OB and BSG primaries, respectively.
Current usage metrics show cumulative count of Article Views (full-text article views including HTML views, PDF and ePub downloads, according to the available data) and Abstracts Views on Vision4Press platform.
Data correspond to usage on the plateform after 2015. The current usage metrics is available 48-96 hours after online publication and is updated daily on week days.
Initial download of the metrics may take a while.