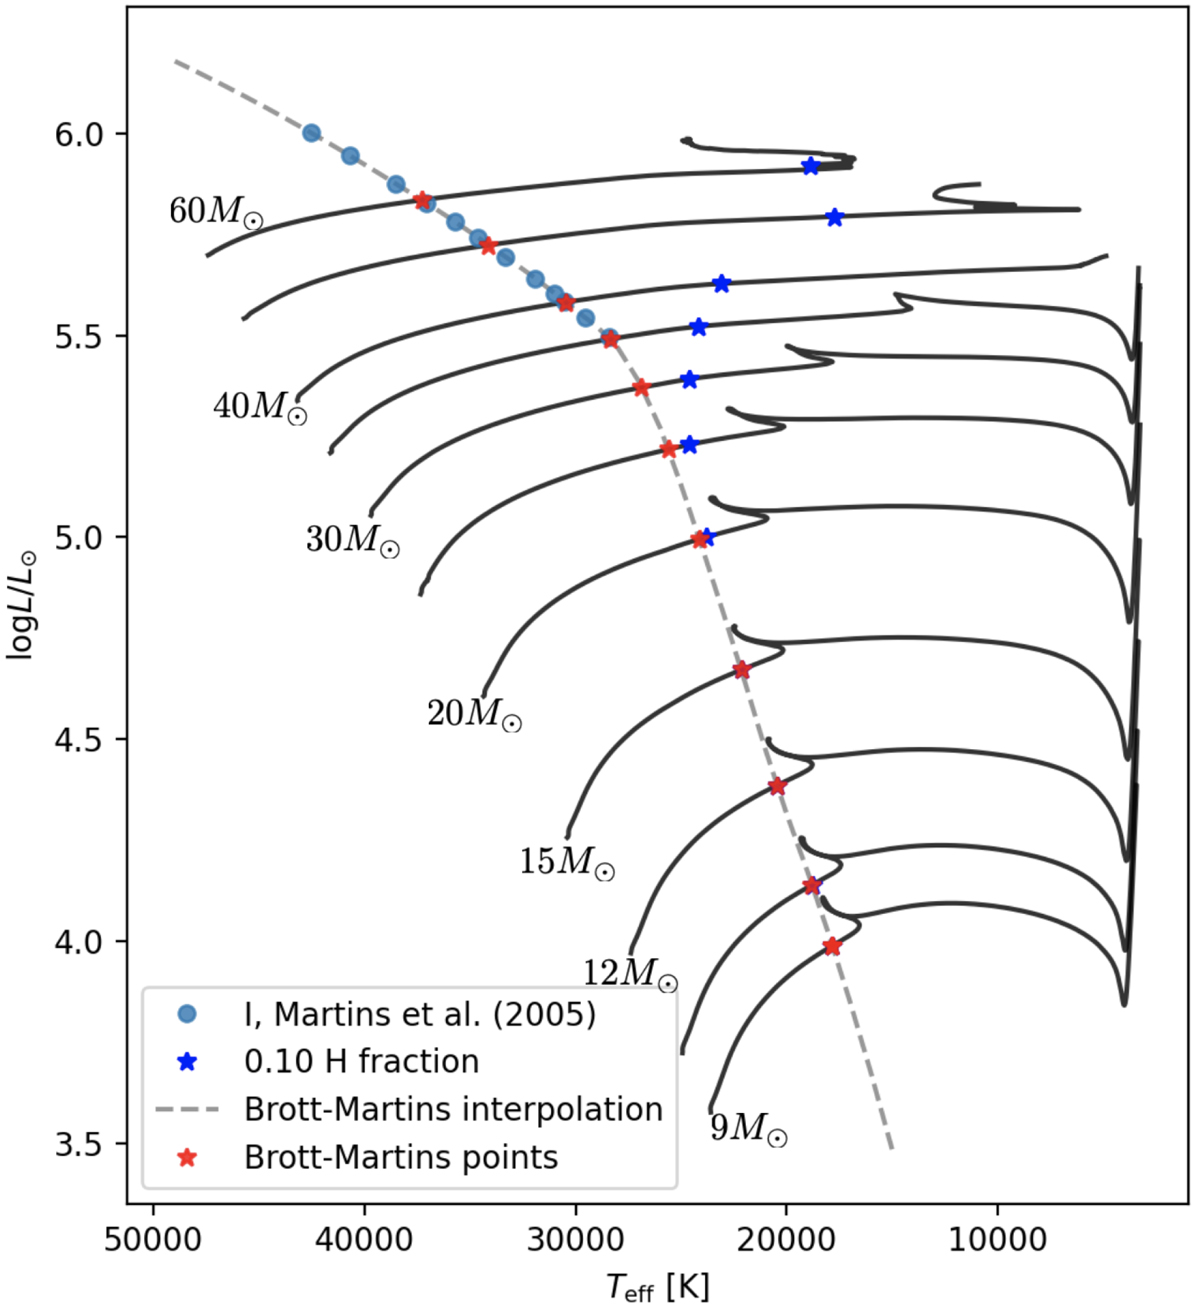
Fig. 2.
Download original image
Positions in the HRD for BSGs. Cyan dots are luminosity-class I stars from Martins et al. (2005) and blue stars are the positions on the tracks corresponding to a 10% core-H fraction. The dashed line represents a second-degree interpolation between the data from Martins et al. (2005) and the four lowest-mass points with a 10% core-H fraction (see text for more details).
Current usage metrics show cumulative count of Article Views (full-text article views including HTML views, PDF and ePub downloads, according to the available data) and Abstracts Views on Vision4Press platform.
Data correspond to usage on the plateform after 2015. The current usage metrics is available 48-96 hours after online publication and is updated daily on week days.
Initial download of the metrics may take a while.