Open Access
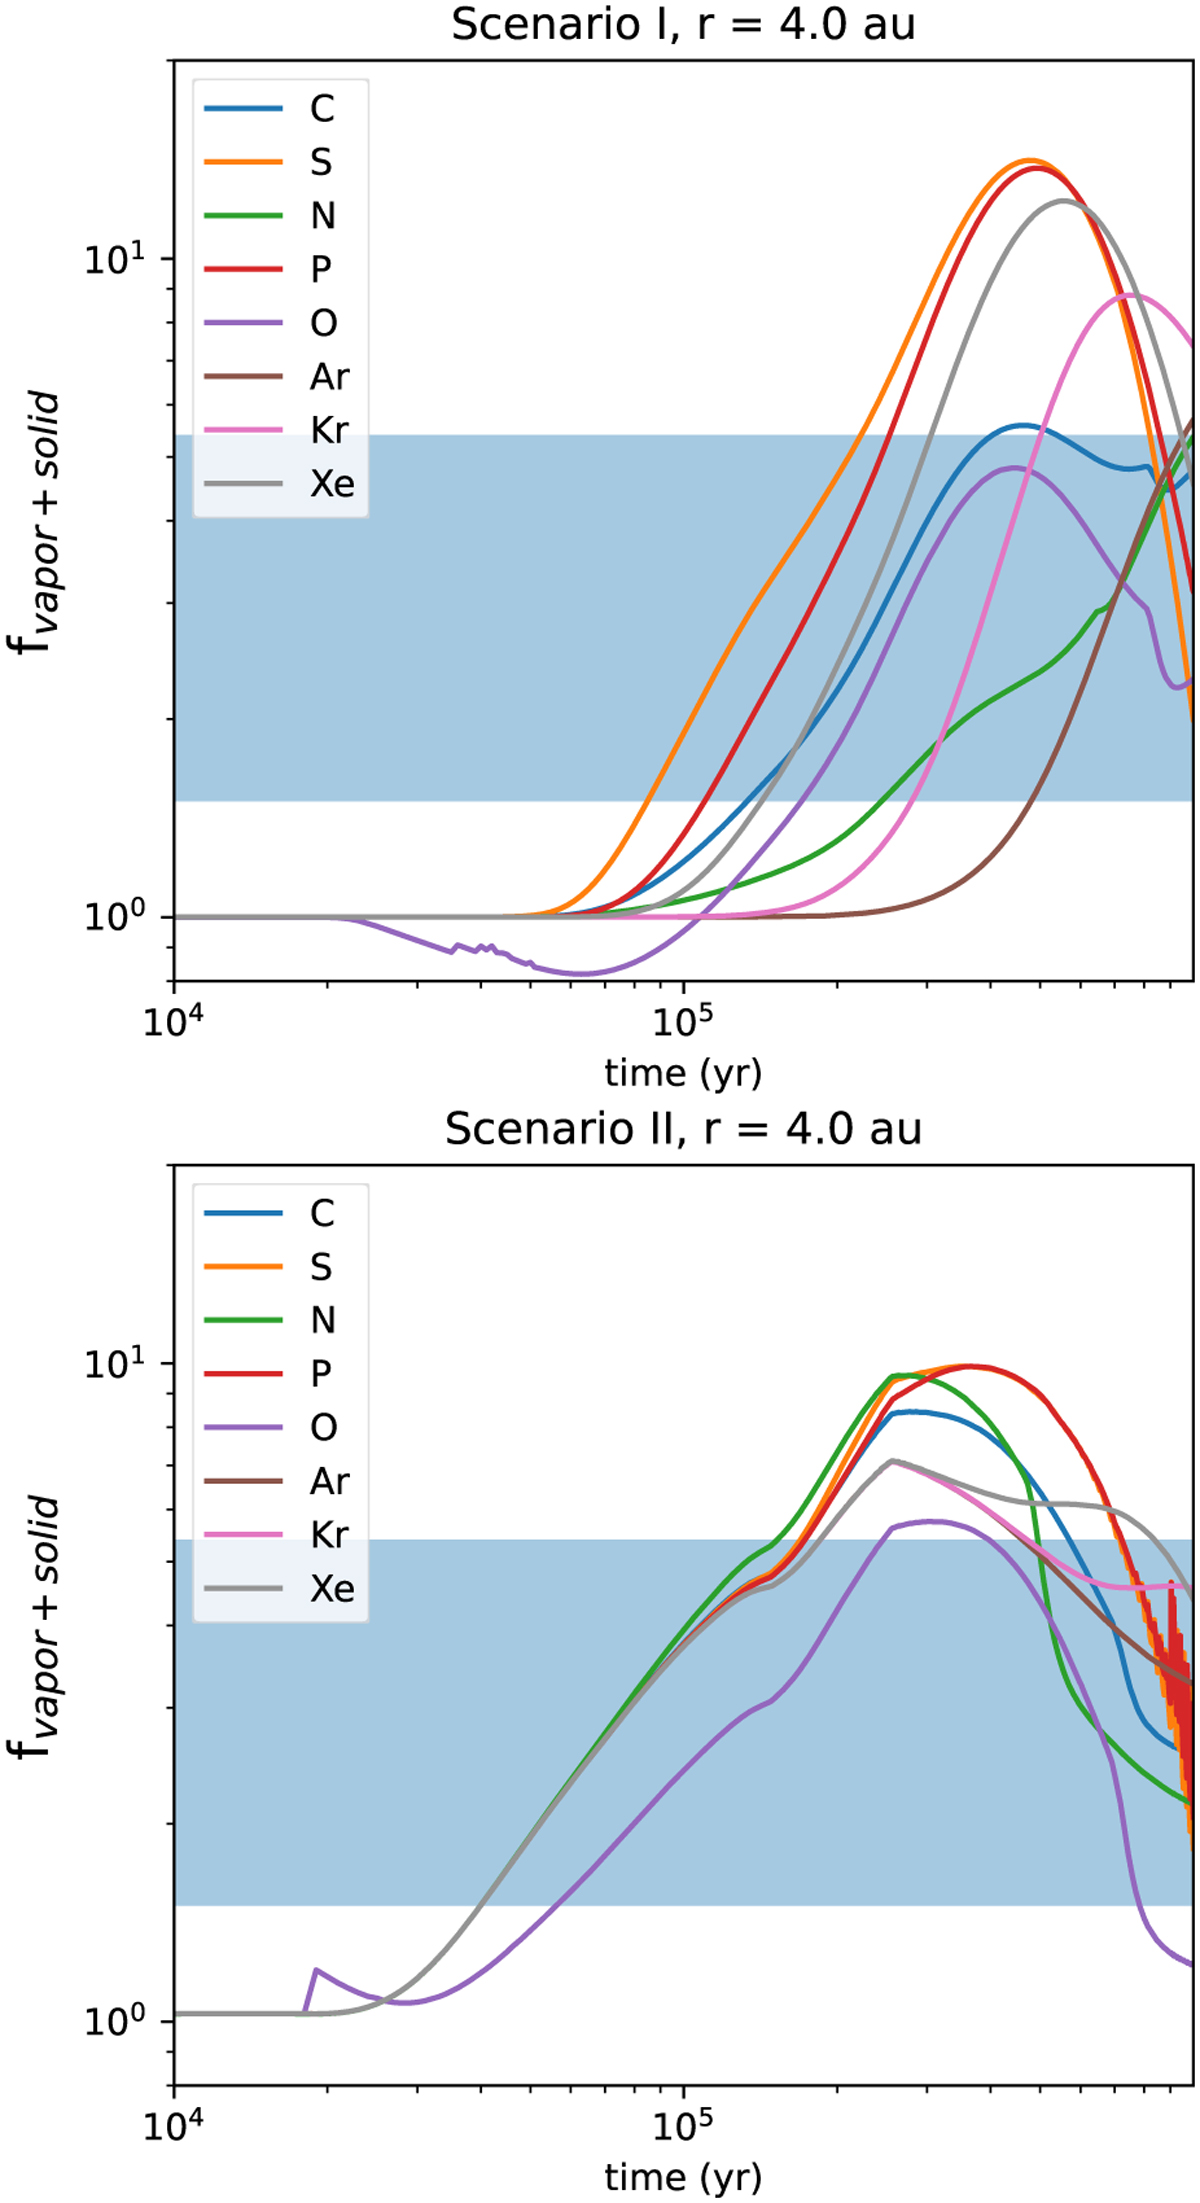
Fig. 9
Download original image
Time evolution of the elemental abundances (relatives to the pro-tosolar values) at a heliocentric distance of 4 au in the cases of scenario 1 (top panel) and scenario 2 (bottom panel). The blue area corresponds to the range covered by the elemental abundances derived from spacecraft measurements (see text).
Current usage metrics show cumulative count of Article Views (full-text article views including HTML views, PDF and ePub downloads, according to the available data) and Abstracts Views on Vision4Press platform.
Data correspond to usage on the plateform after 2015. The current usage metrics is available 48-96 hours after online publication and is updated daily on week days.
Initial download of the metrics may take a while.