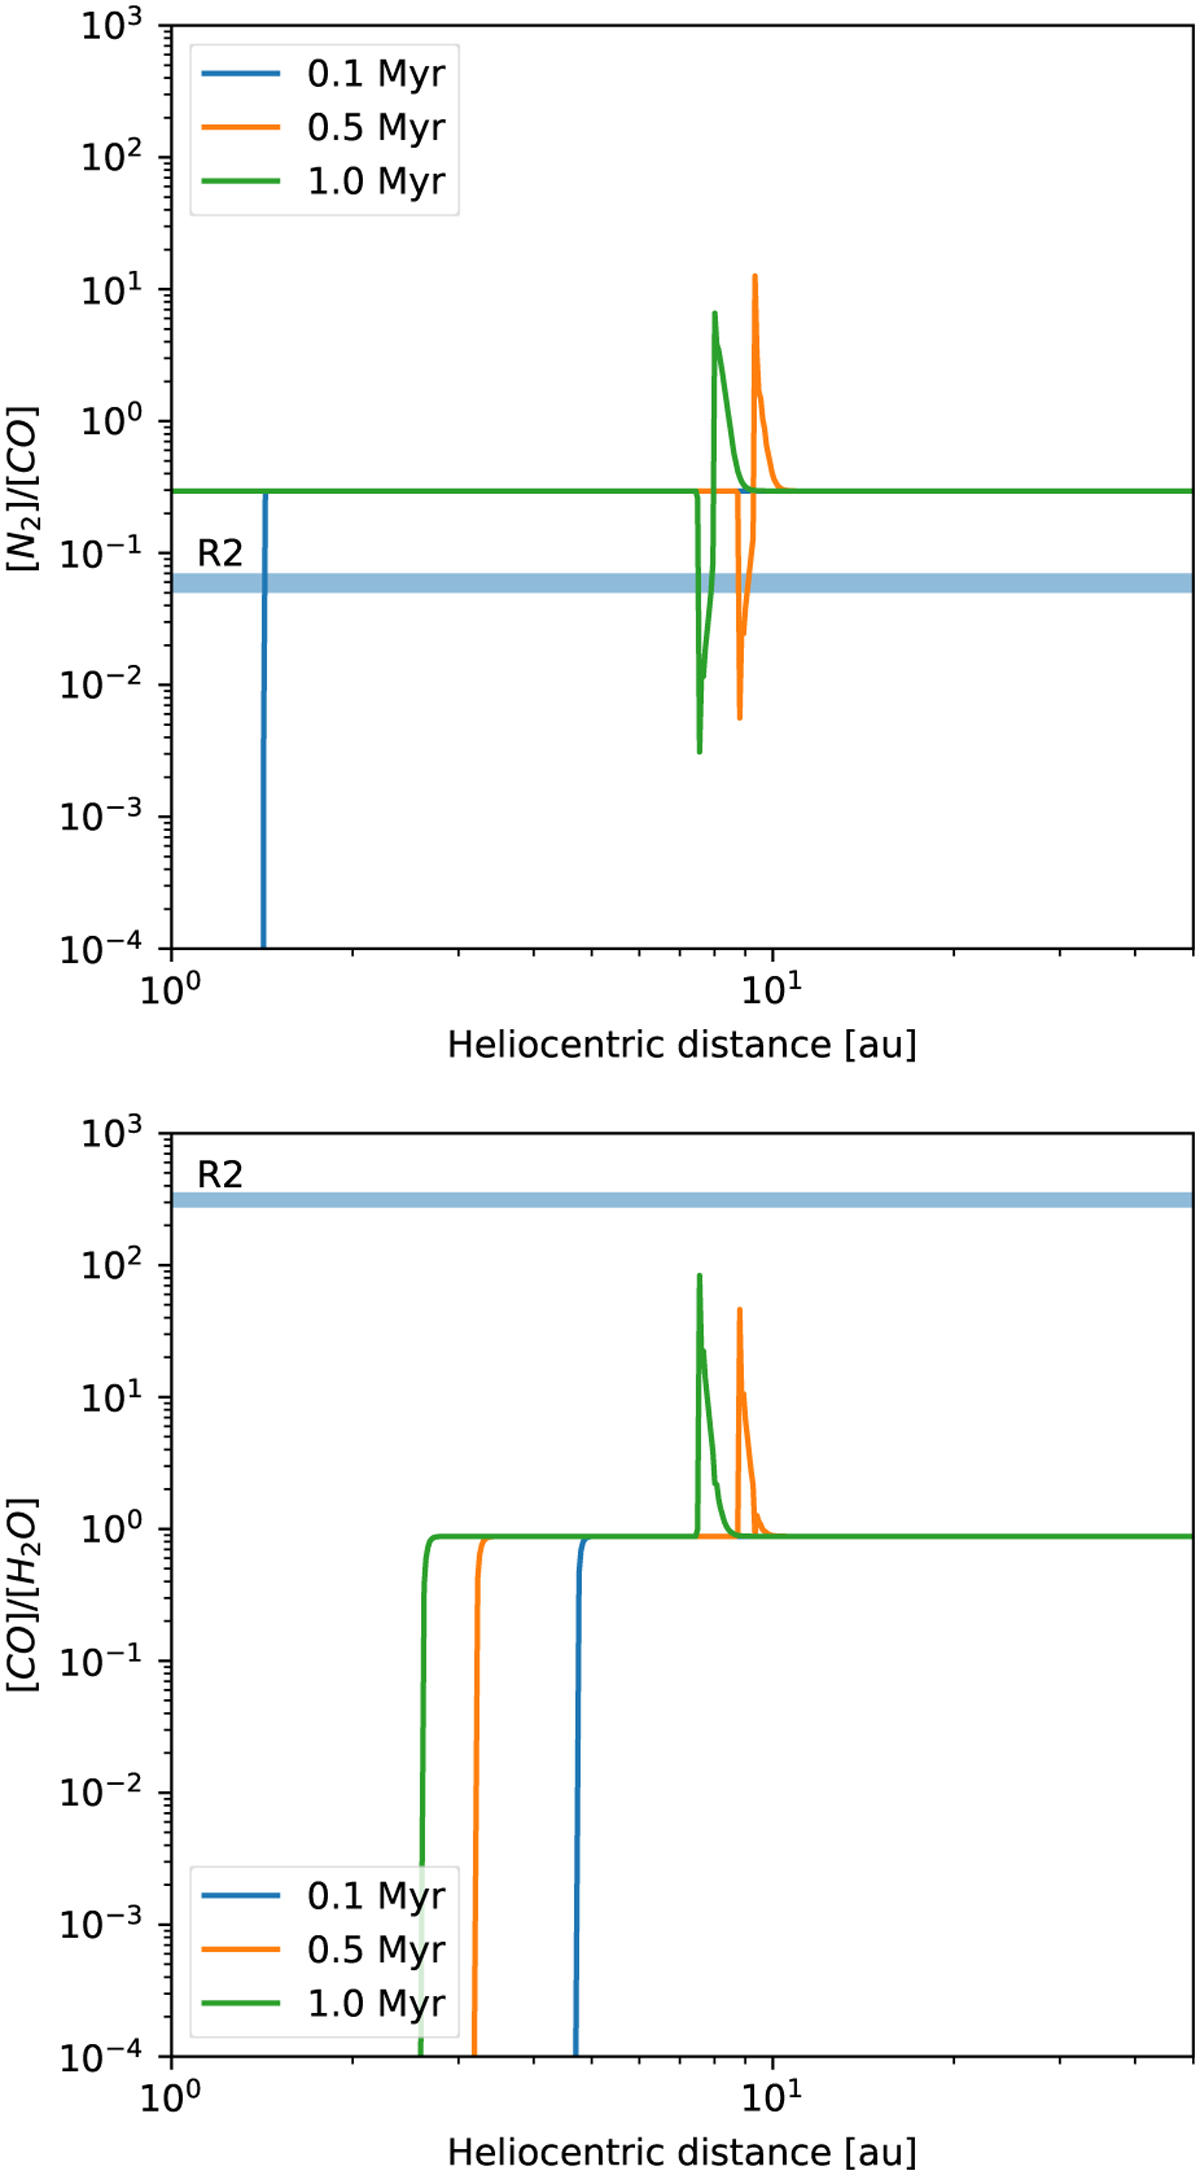
Fig. 8
Download original image
N2/CO (top panel) and CO/H2O (bottom panel) abundance ratios in pebbles represented as a function of heliocentric distance in the case of scenario 2, and compared with those measured in R2’s coma (blue bar) at 0.1, 0.5 and 1 Myr of the PSN evolution. Only the N2/CO ratio is reproduced in R2 at 8 au and 1 Myr. The CO/H2O ratio is however approached by our model at the same location and epoch of the PSN evolution.
Current usage metrics show cumulative count of Article Views (full-text article views including HTML views, PDF and ePub downloads, according to the available data) and Abstracts Views on Vision4Press platform.
Data correspond to usage on the plateform after 2015. The current usage metrics is available 48-96 hours after online publication and is updated daily on week days.
Initial download of the metrics may take a while.