Open Access
Fig. 4
Download original image
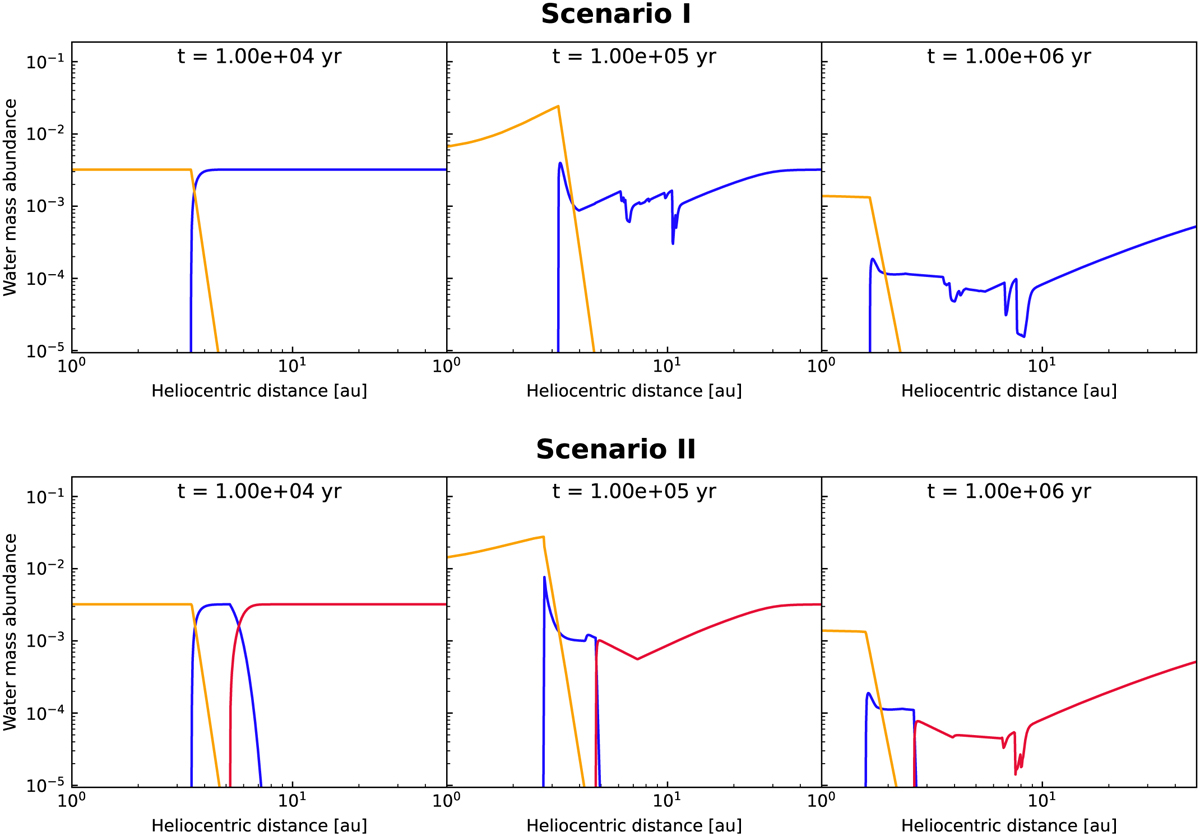
Time evolution of the mass abundance of water, defined as the radial profile of ![]() , for both scenarios at t = 104, 105, and 106 yr. Solid lines represent H2O in the gaseous phase (orange line), crystalline phase (blue line), and in amorphous phase (red line).
, for both scenarios at t = 104, 105, and 106 yr. Solid lines represent H2O in the gaseous phase (orange line), crystalline phase (blue line), and in amorphous phase (red line).
Current usage metrics show cumulative count of Article Views (full-text article views including HTML views, PDF and ePub downloads, according to the available data) and Abstracts Views on Vision4Press platform.
Data correspond to usage on the plateform after 2015. The current usage metrics is available 48-96 hours after online publication and is updated daily on week days.
Initial download of the metrics may take a while.