Fig. 10
Download original image
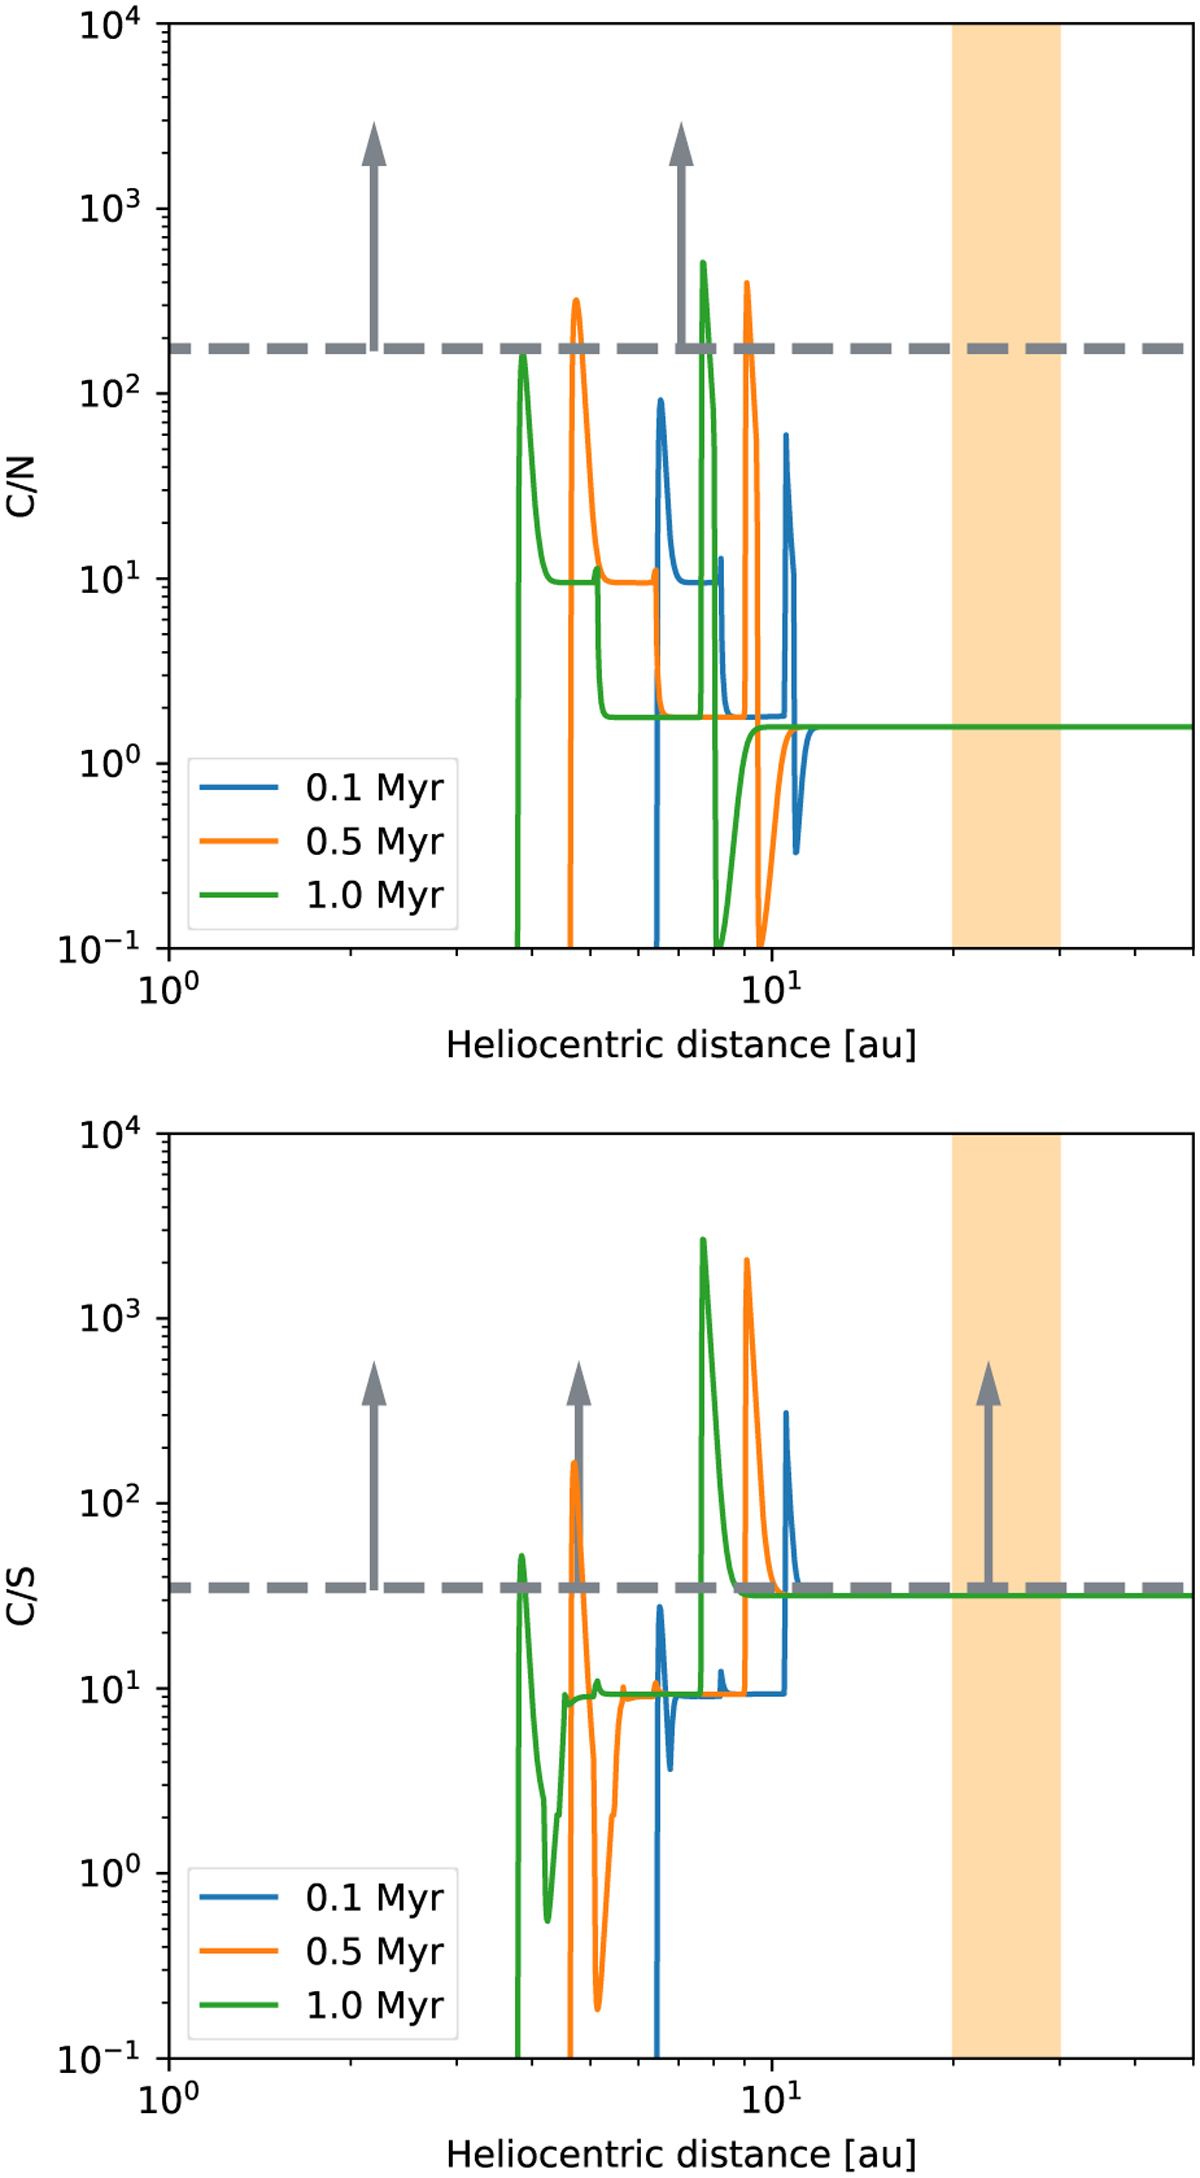
Radial profiles of the C/N (top panel) and C/S (bottom panel) ratios calculated in pebbles at different epochs of the PSN evolution in the case of scenario 1. The horizontal dashed line represents the minimum ratio measured in the tropospheres of Uranus and Neptune. The orange area encompasses the current locations of the ice giants in the solar system.
Current usage metrics show cumulative count of Article Views (full-text article views including HTML views, PDF and ePub downloads, according to the available data) and Abstracts Views on Vision4Press platform.
Data correspond to usage on the plateform after 2015. The current usage metrics is available 48-96 hours after online publication and is updated daily on week days.
Initial download of the metrics may take a while.