Fig. 1
Download original image
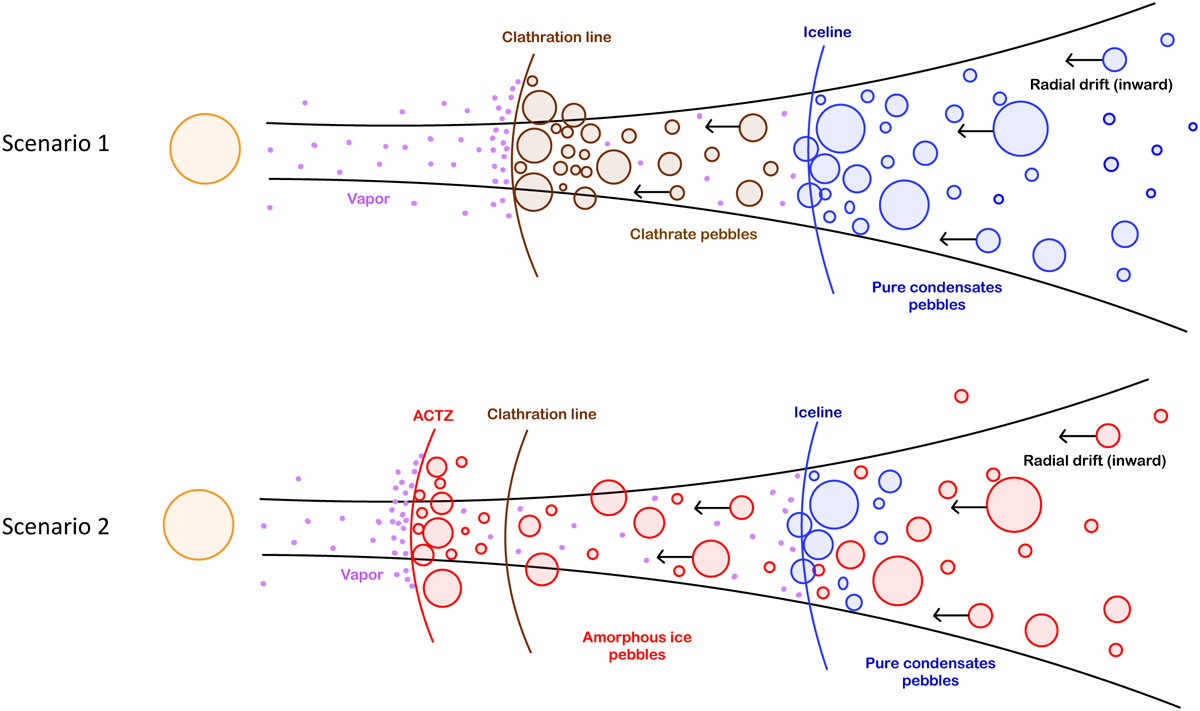
Two outcome scenarios for volatile species explored in this paper. Top panel: the case where volatiles are initially delivered in pure condensate form to the PSN (scenario 1). Bottom panel: the case where volatiles are released in vapor form in the PSN when amorphous grains cross the ACTZ region (scenario 2). Pure condensates, clathrate, and amorphous ice pebbles are represented as blue, brown and red circles, respectively. Vapor is represented as purple dots. The iceline, clathration line, and ACTZ are represented as blue, brown, and red solid lines, respectively. Once delivered to the disk, the phase (solid or gaseous) of each species is determined by the positions of the corresponding condensation, hydration, or clathration lines. Except for the case of CO2, which vaporises at a higher temperature than its clathrate form, hydration, or clathration lines of the volatiles considered are closer to the Sun than their respective icelines. Gaseous volatiles condense or become entrapped (depending on the availability of water ice) when diffusing outward of the locations of their condensation, hydration, or clathration lines. Conversely, volatiles condensed or entrapped in grains or pebbles are released in vapor form when drifting inward of their lines. Peaks of abundances form close to each phase-transition line (see text). Those enrichments are represented by higher solid and vapor concentrations in the panels.
Current usage metrics show cumulative count of Article Views (full-text article views including HTML views, PDF and ePub downloads, according to the available data) and Abstracts Views on Vision4Press platform.
Data correspond to usage on the plateform after 2015. The current usage metrics is available 48-96 hours after online publication and is updated daily on week days.
Initial download of the metrics may take a while.