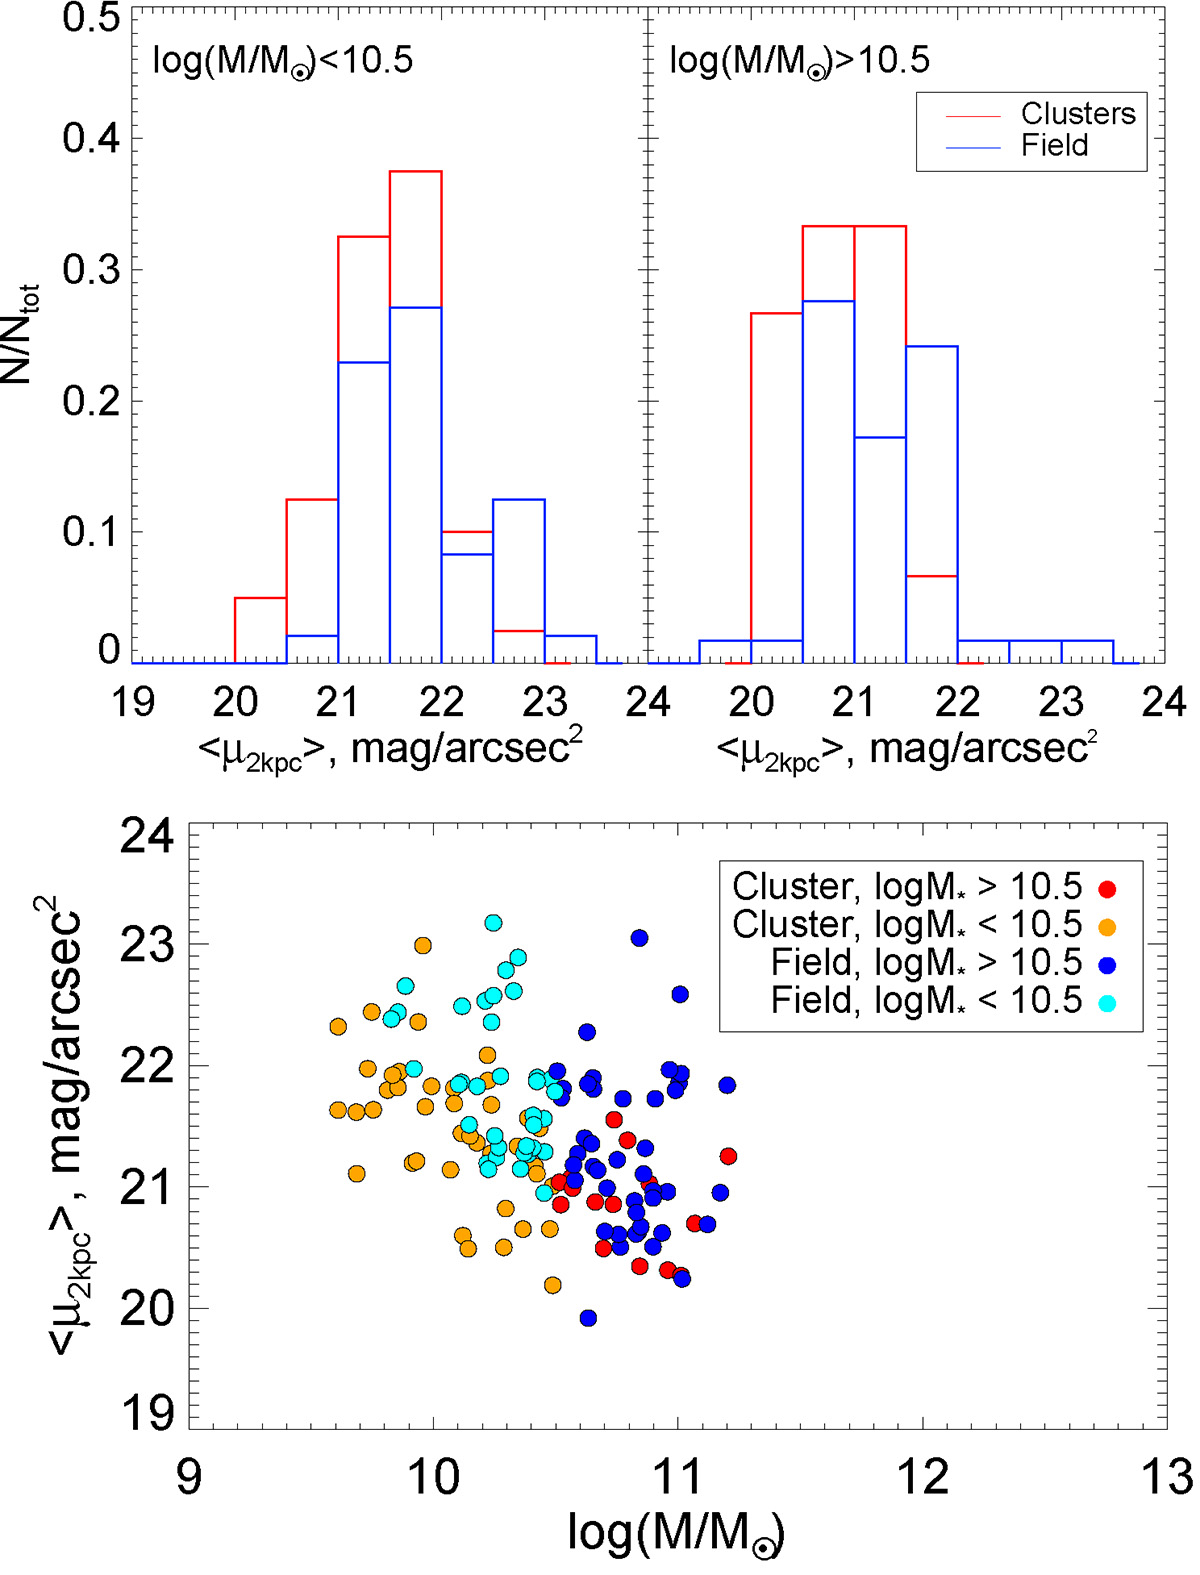
Fig. 9.
Download original image
Galaxy average surface brightness in clusters and in the field. Top: Histogram of the galaxy average surface brightness within 2 kpc, normalized to the total number of galaxies in each sample. The continuous red and blue lines show cluster and field galaxies, respectively. Bottom: Dependence of 2 kpc average surface brightness on galaxy mass in mass bins as shown in the labels. More massive galaxies have on average brighter inner regions. In both cases, the figures show that cluster and field galaxies have similar surface brighness distributions.
Current usage metrics show cumulative count of Article Views (full-text article views including HTML views, PDF and ePub downloads, according to the available data) and Abstracts Views on Vision4Press platform.
Data correspond to usage on the plateform after 2015. The current usage metrics is available 48-96 hours after online publication and is updated daily on week days.
Initial download of the metrics may take a while.