Fig. 7.
Download original image
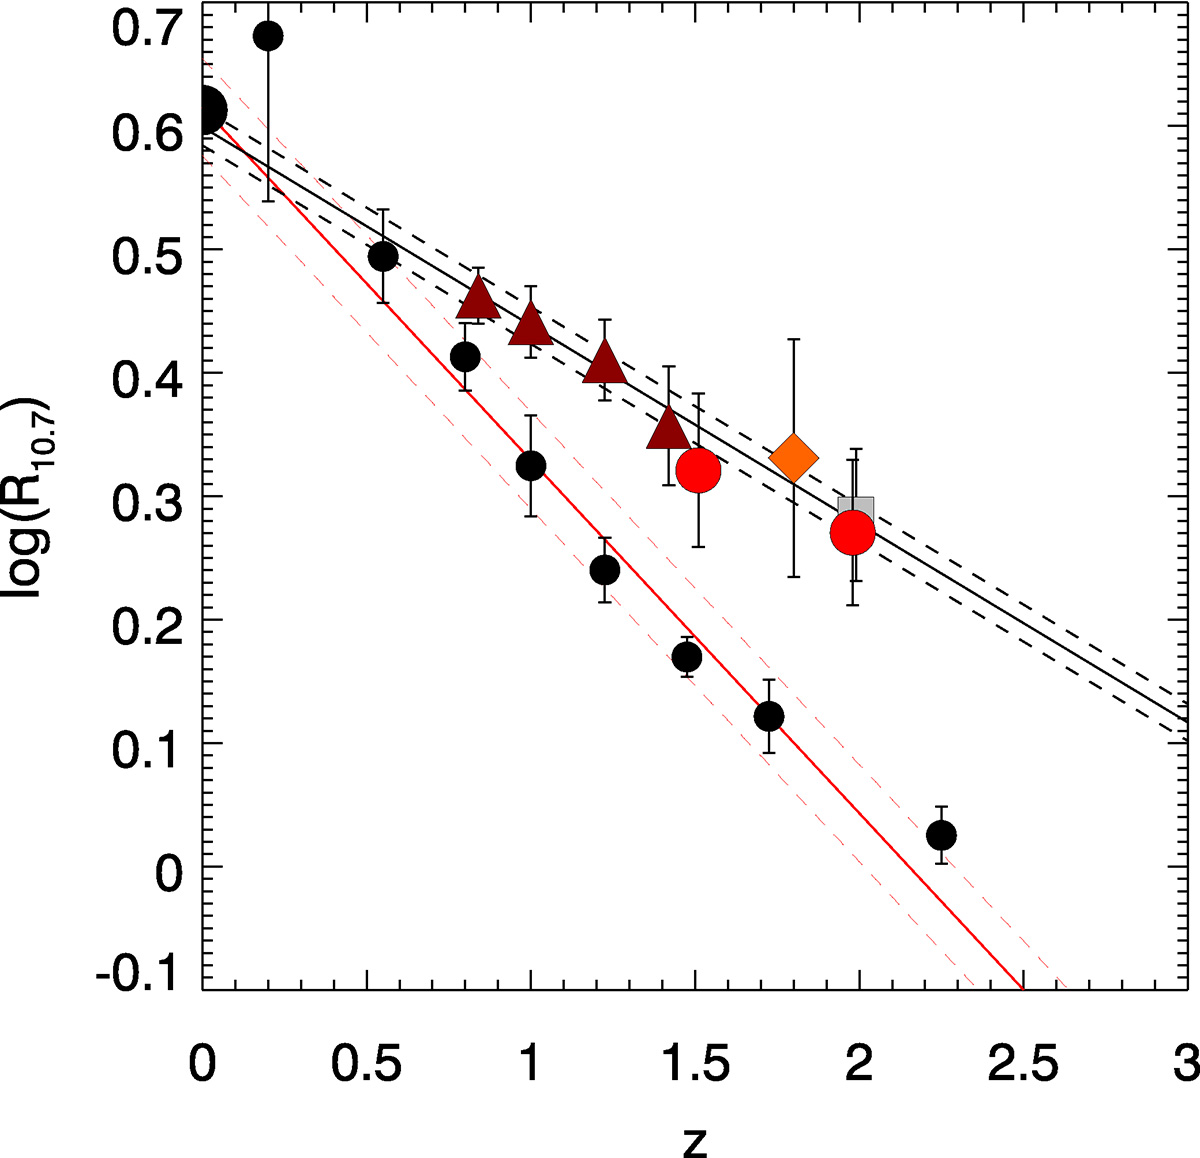
Evolution of the passive ETG mass-normalized radius R10.7 (see text) with redshift. The red circles are the CARLA sample (this paper). The brown triangles, gray squares, and orange diamonds show observations from Delaye et al. (2014), Strazzullo et al. (2013), and Newman et al. (2014), respectively. The black circles are field ETG sizes taken from Bernardi et al. (2014) and Huertas-Company et al. (2013b) for z = 0, and from van der Wel et al. (2014) for the other redshifts.
Current usage metrics show cumulative count of Article Views (full-text article views including HTML views, PDF and ePub downloads, according to the available data) and Abstracts Views on Vision4Press platform.
Data correspond to usage on the plateform after 2015. The current usage metrics is available 48-96 hours after online publication and is updated daily on week days.
Initial download of the metrics may take a while.