Open Access
Fig. 6.
Download original image
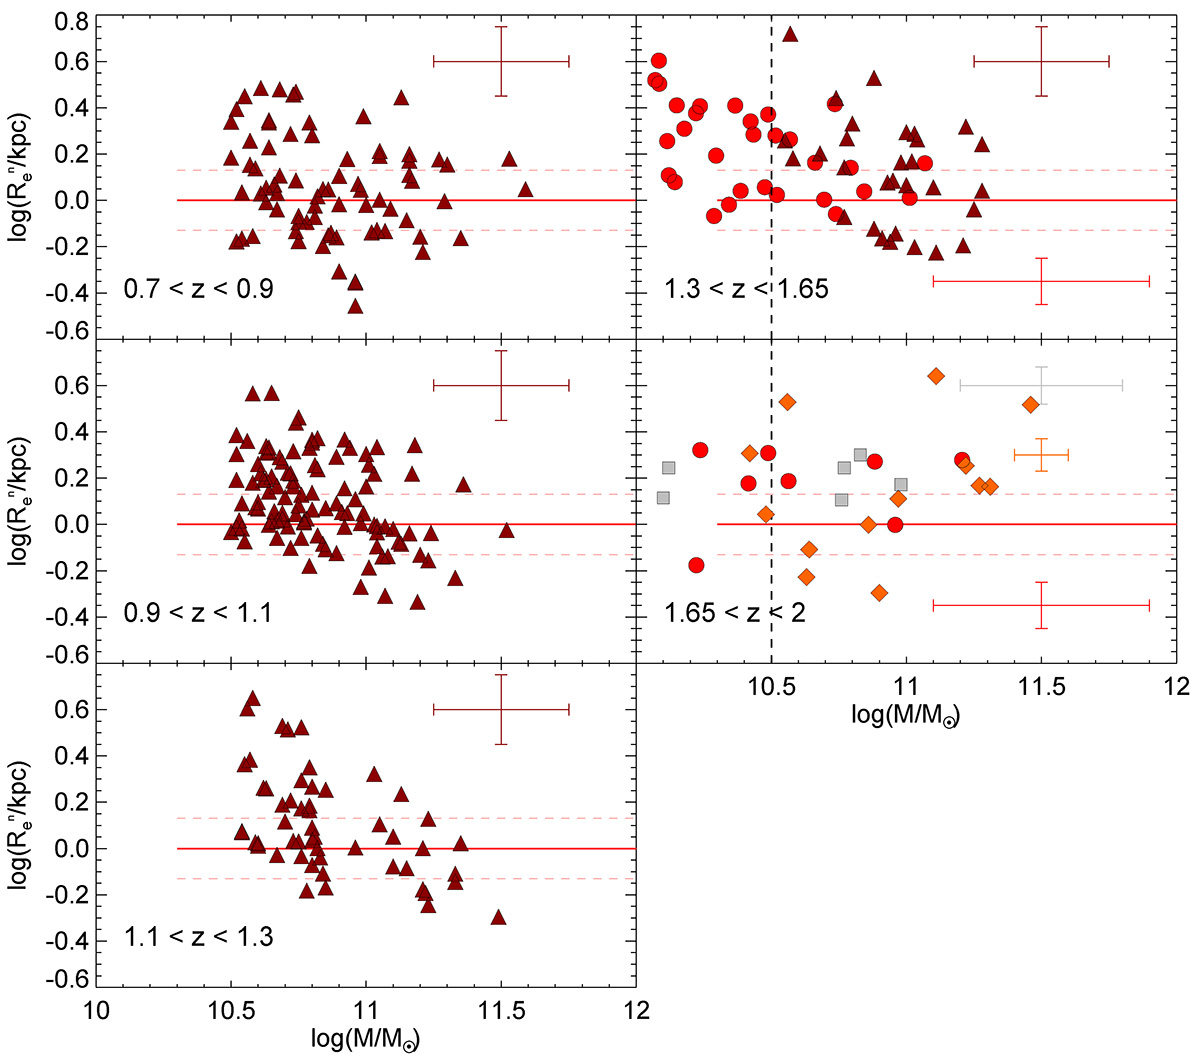
Effective radii normalized to the passive MSR from van der Wel et al. (2014), ![]() , for the same observations as Fig. 5. The symbols are the same as in Fig. 5. The average data uncertainties are shown in their corresponding color on the right-hand side of each subplot.
, for the same observations as Fig. 5. The symbols are the same as in Fig. 5. The average data uncertainties are shown in their corresponding color on the right-hand side of each subplot.
Current usage metrics show cumulative count of Article Views (full-text article views including HTML views, PDF and ePub downloads, according to the available data) and Abstracts Views on Vision4Press platform.
Data correspond to usage on the plateform after 2015. The current usage metrics is available 48-96 hours after online publication and is updated daily on week days.
Initial download of the metrics may take a while.