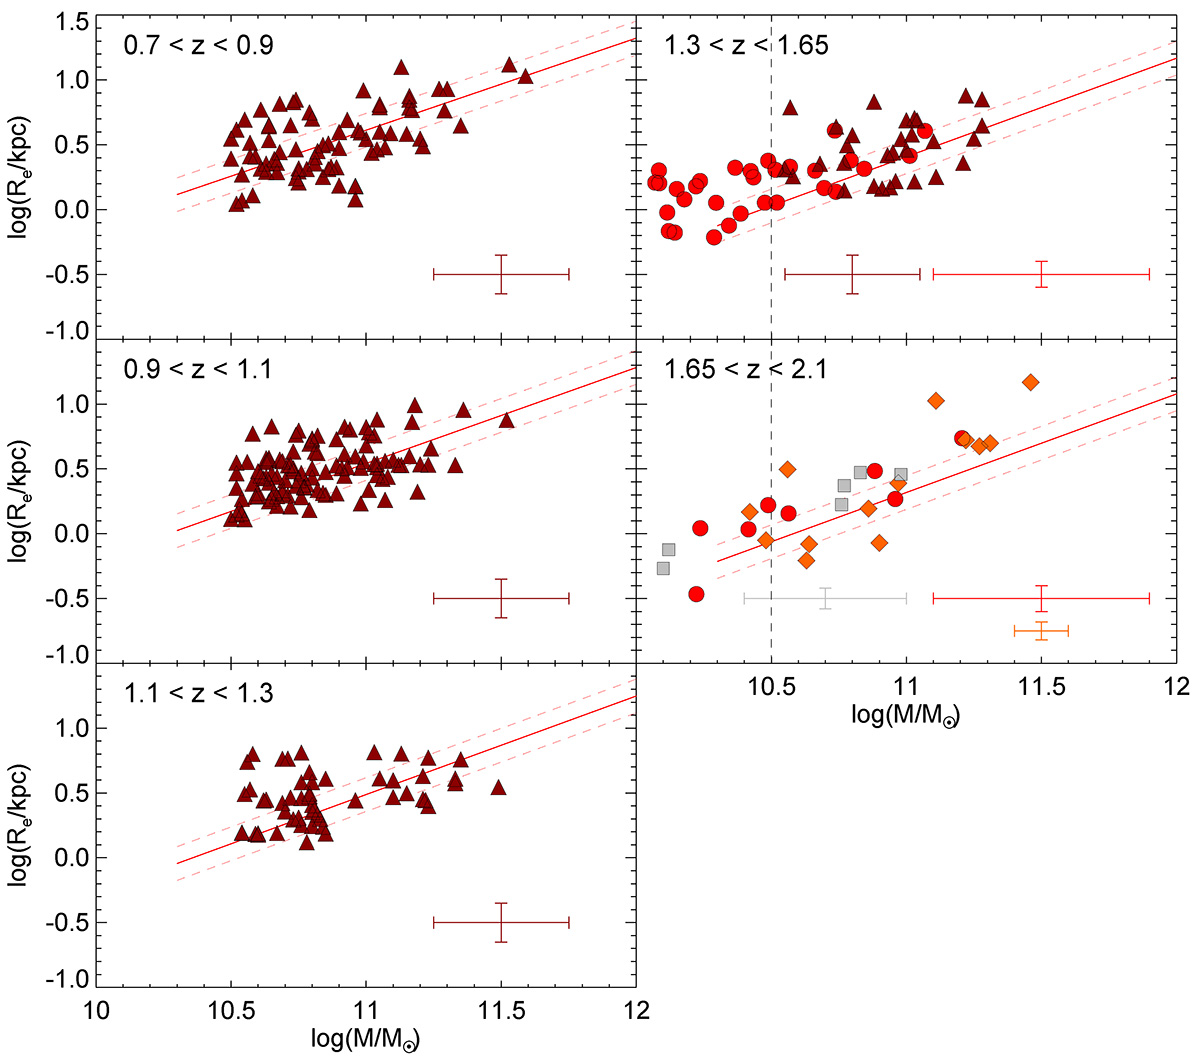
Fig. 5.
Download original image
Cluster passive ETG MSRs compared to the field MSRs (van der Wel et al. 2014) in different redshift bins. The red circles are the CARLA sample (this paper). The brown triangles, gray squares, and orange diamonds are observations from Delaye et al. (2014), Strazzullo et al. (2013), and Newman et al. (2014), respectively. The red continuous line is the van der Wel et al. (2014) CANDELS passive galaxy relation, and the dashed lines show the 1σ uncertainty. The vertical black dashed line shows the lower limit of our high mass sample. The average data uncertainties are shown in their corresponding color in the bottom-right corner of each subplot. Cluster passive ETG are systematically larger than CANDELS passive galaxies.
Current usage metrics show cumulative count of Article Views (full-text article views including HTML views, PDF and ePub downloads, according to the available data) and Abstracts Views on Vision4Press platform.
Data correspond to usage on the plateform after 2015. The current usage metrics is available 48-96 hours after online publication and is updated daily on week days.
Initial download of the metrics may take a while.