Fig. 4.
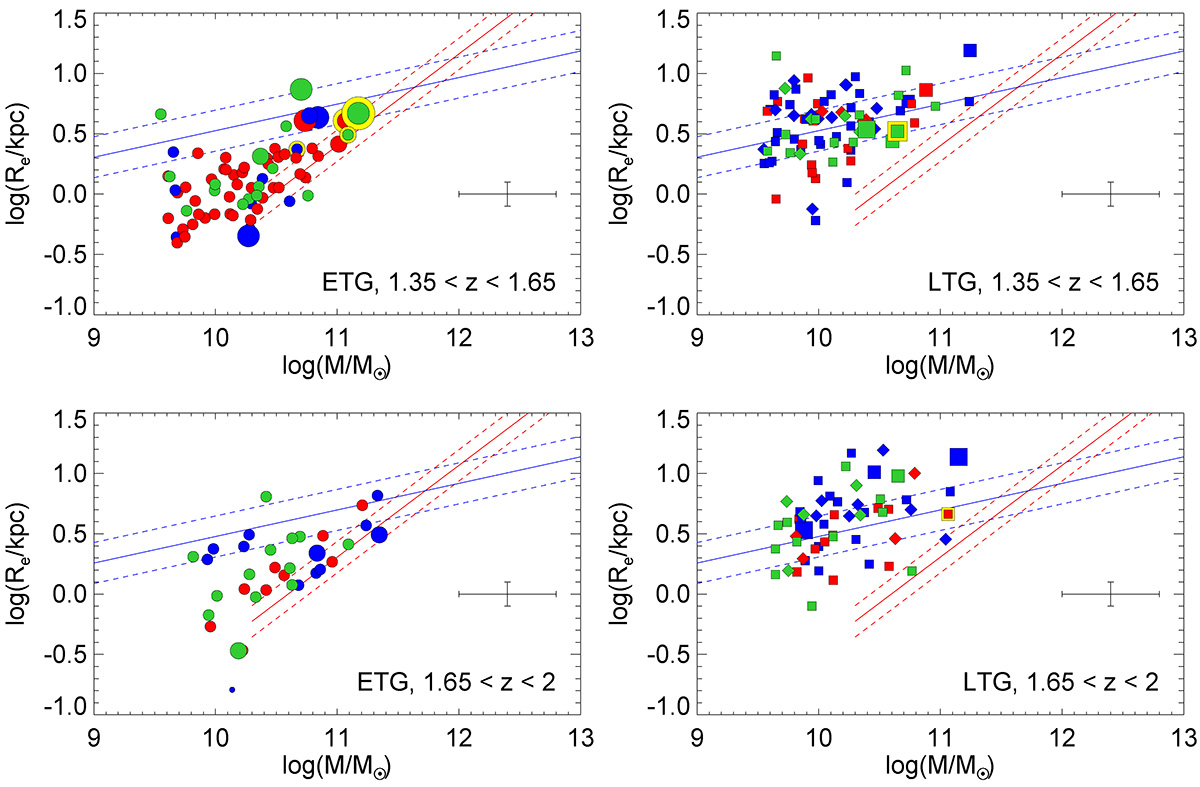
Download original image
MSR in two redshift bins. The symbols are the same as in Fig. 3. The van der Wel et al. (2014)’s MSRs are shown at the mean redshift of each bin (z = 1.47 and z = 1.80). The CANDELS passive galaxy MSR is shown at log(M/M⊙) > 10.3 to reflect the fitting range in van der Wel et al. (2014). The average measurement uncertainty is provided on the right-hand side of each box. In both redshifts bins, cluster active and LTG galaxies lie on the van der Wel et al. (2014) active galaxy MSR. Cluster passive ETGs have systematically larger sizes than van der Wel et al. (2014)’s passive galaxies.
Current usage metrics show cumulative count of Article Views (full-text article views including HTML views, PDF and ePub downloads, according to the available data) and Abstracts Views on Vision4Press platform.
Data correspond to usage on the plateform after 2015. The current usage metrics is available 48-96 hours after online publication and is updated daily on week days.
Initial download of the metrics may take a while.