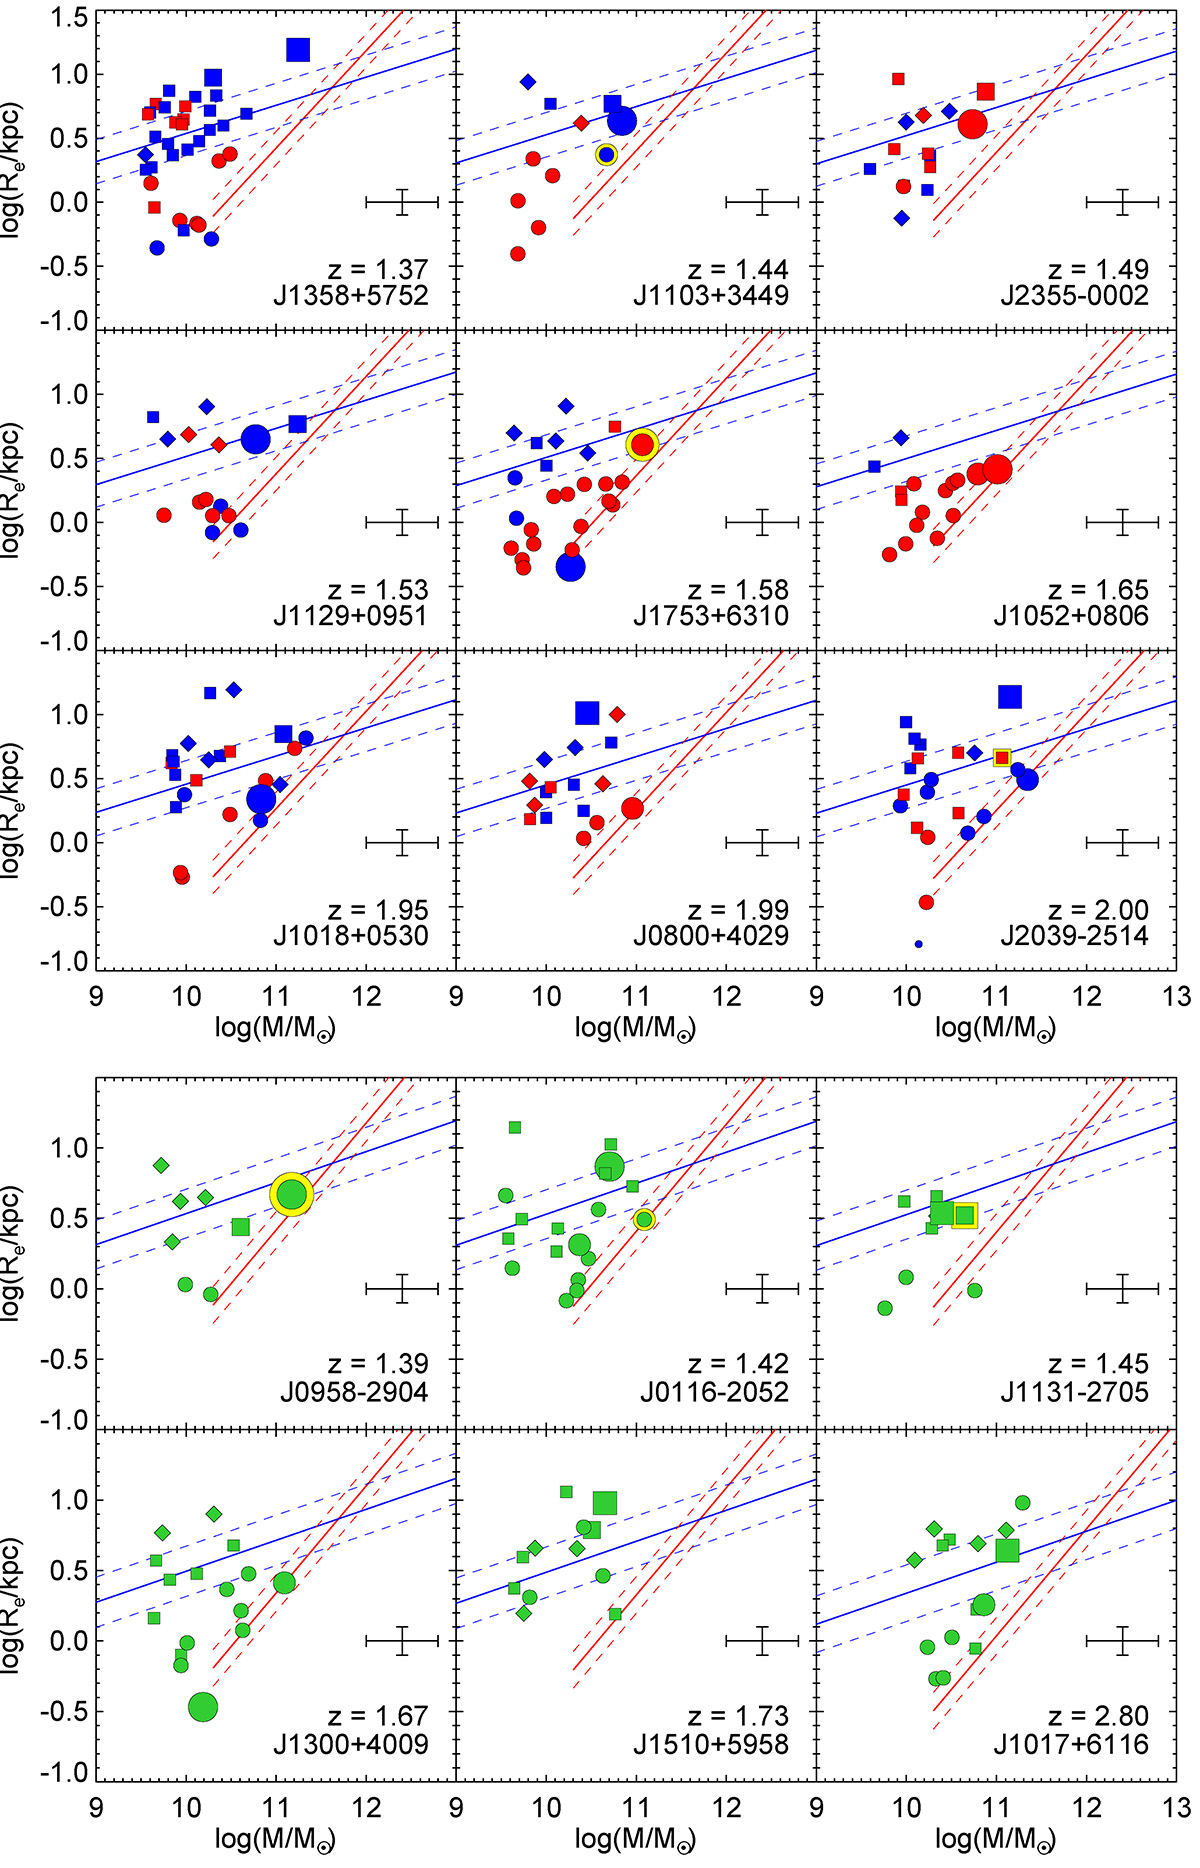
Fig. 3.
Download original image
MSRs for each cluster. Red and blue colors show passive [log(sSFR) < −9.5 yr−1] and active galaxies, respectively. Green symbols show galaxies for which we could not separate passive from active galaxies. Circles, squares, and diamonds correspond to ETGs, LTGs and irregulars, respectively. The largest symbols show the BCGs the second largest indicate the second brightest galaxies. The compact galaxy in the J2039-2514 is shown by the smaller symbol. A yellow halo around the galaxy symbol indicates a HzRG. The red and blue solid lines are CANDELS van der Wel et al. (2014)’s MSRs for passive and active galaxies, respectively, interpolated to the redshift of each cluster. The CANDELS passive galaxy MSR is shown at log(M/M⊙) > 10.3 to reflect the fitting range in van der Wel et al. (2014). The dashed lines are 1-σ scatter for these relations. The average measurement uncertainty is provided on the right-hand side of each box. Cluster active galaxies and LTGs lie on the van der Wel et al. (2014)’s active galaxy MSR. Cluster passive ETGs have systematically larger sizes than van der Wel et al. (2014)’s passive galaxies.
Current usage metrics show cumulative count of Article Views (full-text article views including HTML views, PDF and ePub downloads, according to the available data) and Abstracts Views on Vision4Press platform.
Data correspond to usage on the plateform after 2015. The current usage metrics is available 48-96 hours after online publication and is updated daily on week days.
Initial download of the metrics may take a while.