Fig. 9
Download original image
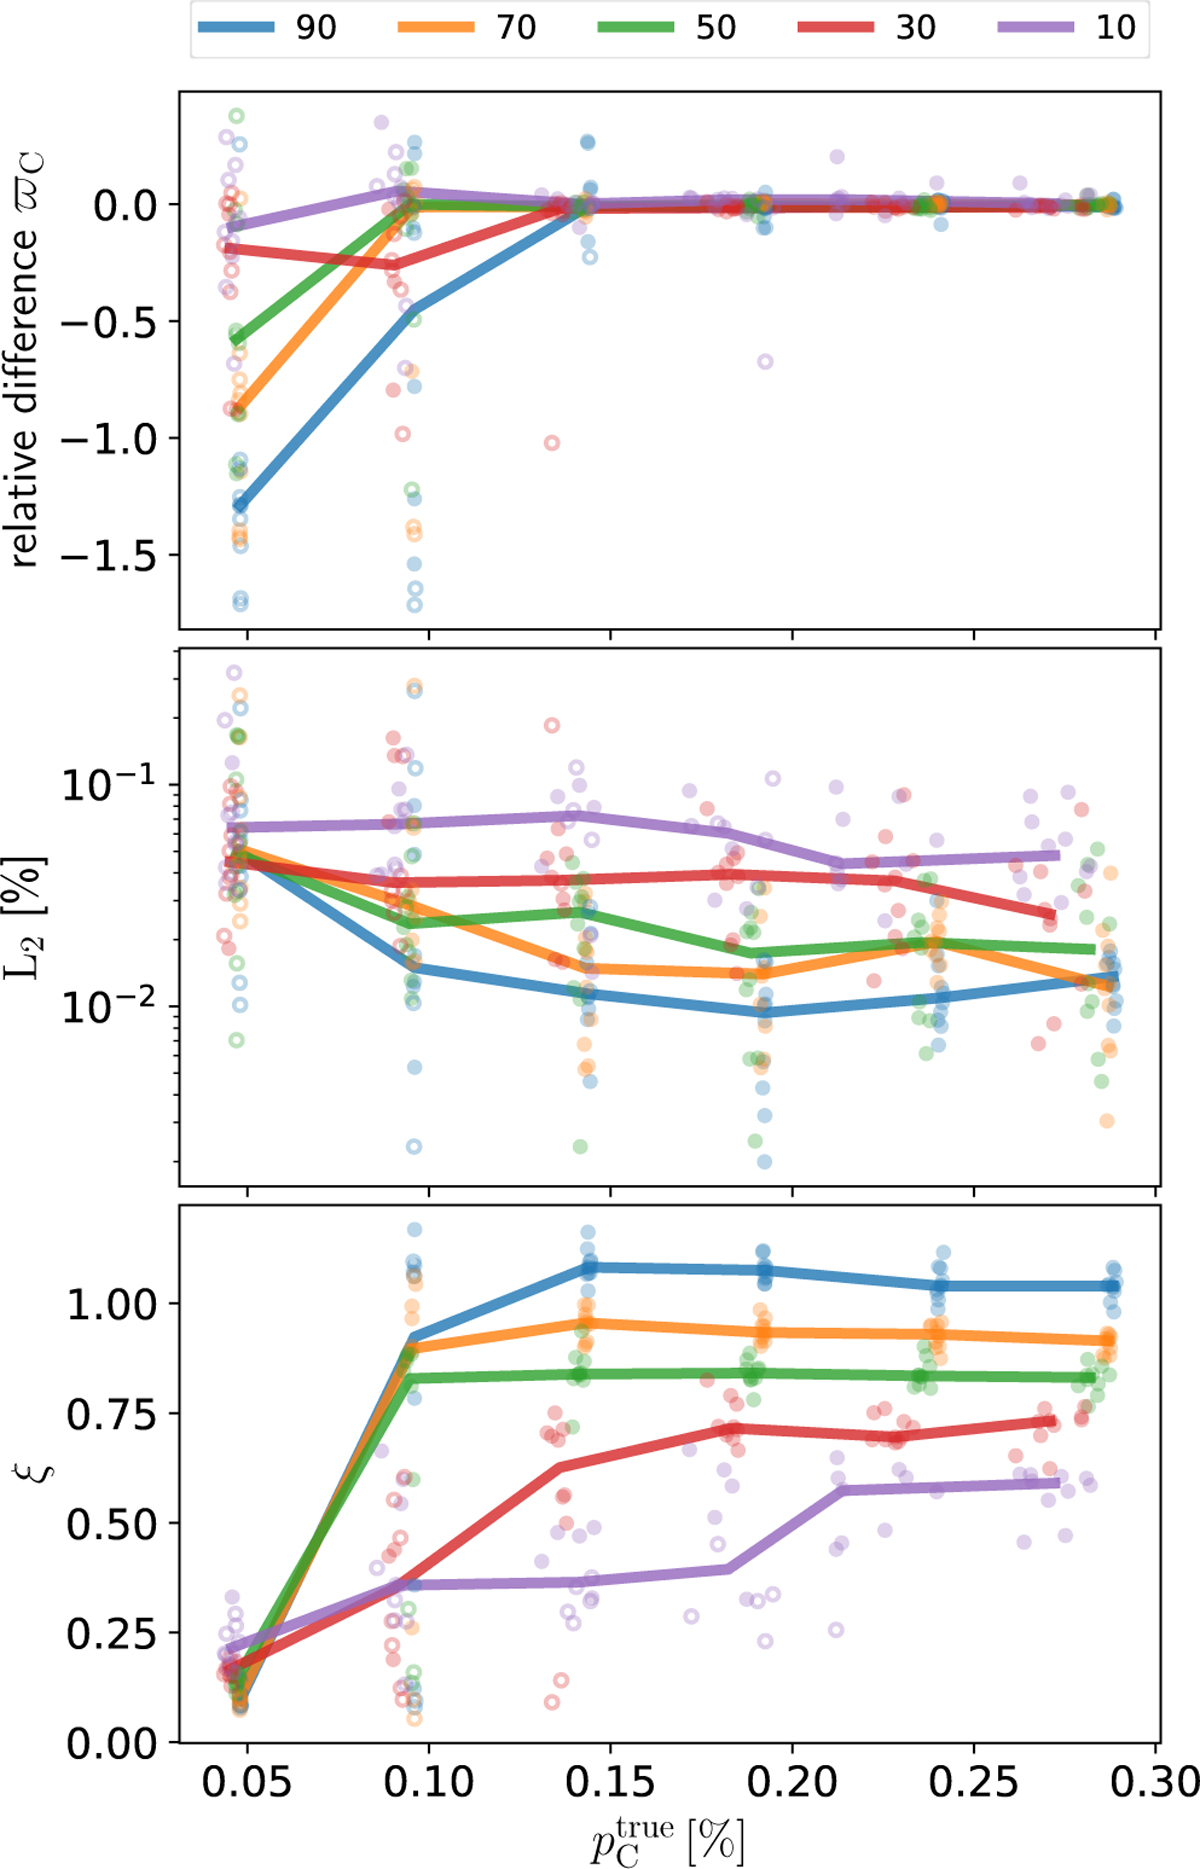
Performance of the inversion method as a function of the true polarization signal for different cloud distances, probed by the values of fbg, shown in the legend and given in per cent. The method is applied to simulated data from the 1° aperture star sample (345 stars). Top: relative difference between the cloud parallax at maximum log-likelihood with the parallax of the closest star to the input cloud ![]() . Middle: L2, distance between the true and estimated mean polarization vector. Bottom: ξ, the ratio between ideal and estimated posterior size on clouds’ Stokes parameters. Pmax varies in multiples of 0.05%,
. Middle: L2, distance between the true and estimated mean polarization vector. Bottom: ξ, the ratio between ideal and estimated posterior size on clouds’ Stokes parameters. Pmax varies in multiples of 0.05%, ![]() and Aturb = 0.2 and 10 simulated samples are obtained by varying
and Aturb = 0.2 and 10 simulated samples are obtained by varying ![]() . For the same fbg, the solid lines connect the median of the 10 reconstructions on simulated samples with the same Pmax. Filled (empty) symbols correspond to fits that pass (do not pass) the
. For the same fbg, the solid lines connect the median of the 10 reconstructions on simulated samples with the same Pmax. Filled (empty) symbols correspond to fits that pass (do not pass) the ![]() criterion explained in the text.
criterion explained in the text.
Current usage metrics show cumulative count of Article Views (full-text article views including HTML views, PDF and ePub downloads, according to the available data) and Abstracts Views on Vision4Press platform.
Data correspond to usage on the plateform after 2015. The current usage metrics is available 48-96 hours after online publication and is updated daily on week days.
Initial download of the metrics may take a while.