Fig. 8
Download original image
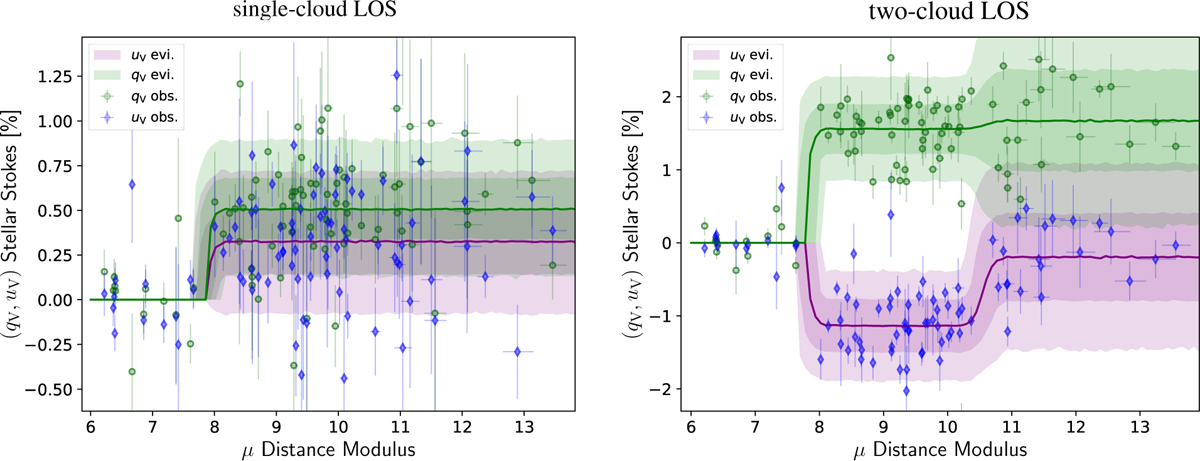
Representation of the model evidences obtained for the single-cloud LOS (left) and two-cloud LOS (right). The data points are the same as in Fig. 1. The shaded areas illustrate the distributions of (qV, uV) obtained at every μ value through re-sampling of the posterior distributions obtained from the maximum-likelihood analysis of the data, as explained in the text.
Current usage metrics show cumulative count of Article Views (full-text article views including HTML views, PDF and ePub downloads, according to the available data) and Abstracts Views on Vision4Press platform.
Data correspond to usage on the plateform after 2015. The current usage metrics is available 48-96 hours after online publication and is updated daily on week days.
Initial download of the metrics may take a while.