Fig. 5
Download original image
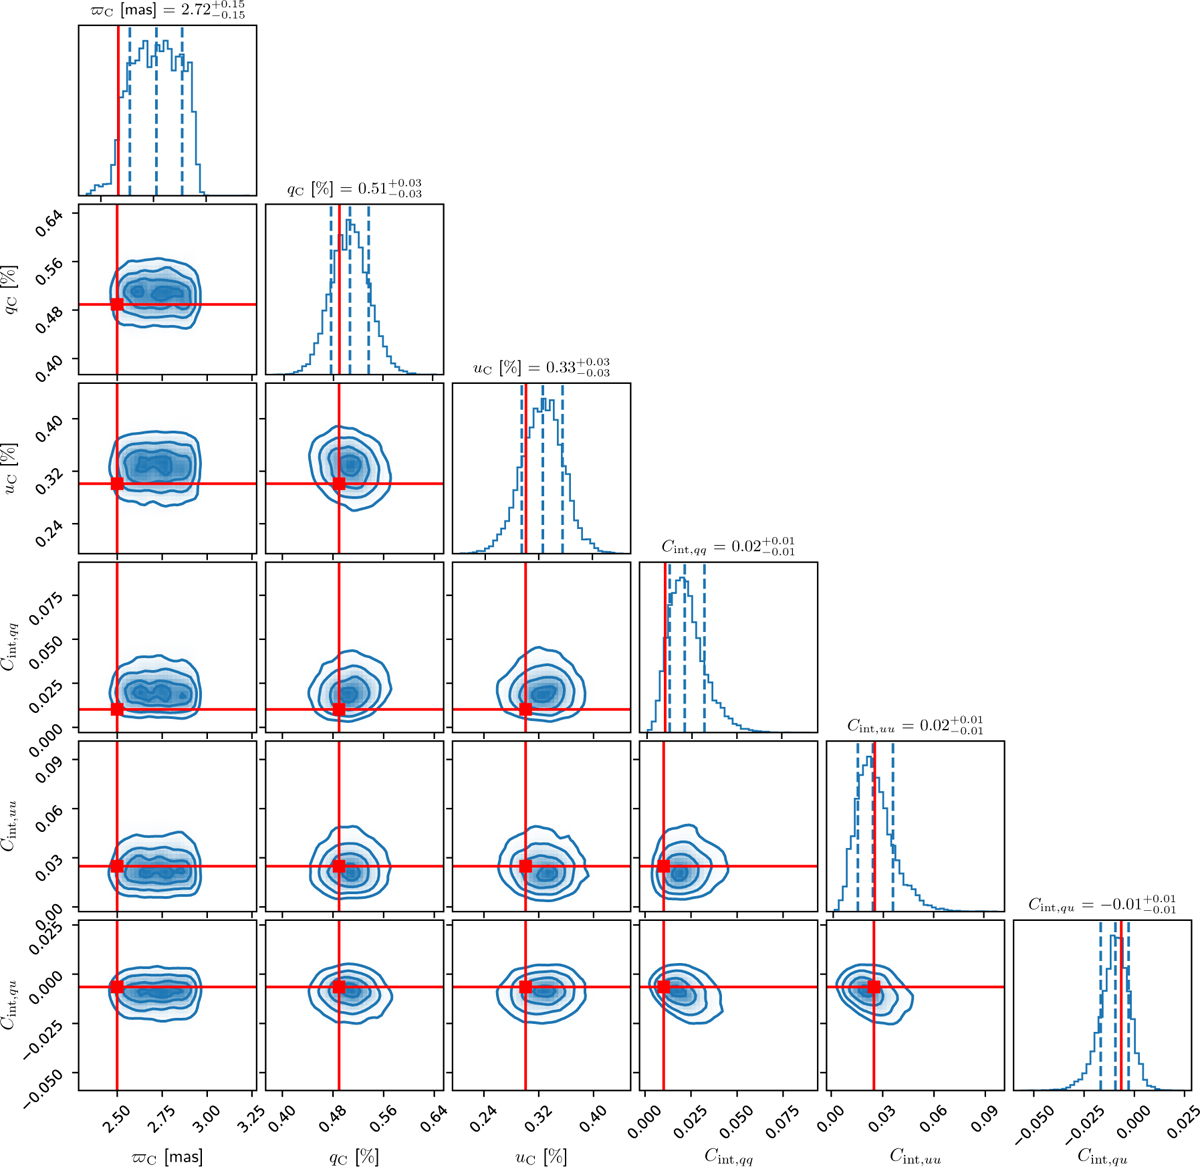
Performance of the one-layer model in fitting the single-cloud mock dataset. 1D and 2D marginalized posterior distributions for the sampled model parameters obtained by log-likelihood maximization. The red lines indicate the true parameter values. Cloud parallax (ϖC) is given in milli-arcseconds (mas), mean Stokes parameters (qC, uC) in per cent and the elements of the covariance matrix encoding the effect of the turbulence-induced intrinsic scatter are given in per cent to the square (i.e., multiplied by 10,000). The dashed vertical lines indicate the 16, 50, and 84 percentiles of the 1D marginalized distributions and the values for the 68% confidence interval can be read from the title on each of the diagonal panels.
Current usage metrics show cumulative count of Article Views (full-text article views including HTML views, PDF and ePub downloads, according to the available data) and Abstracts Views on Vision4Press platform.
Data correspond to usage on the plateform after 2015. The current usage metrics is available 48-96 hours after online publication and is updated daily on week days.
Initial download of the metrics may take a while.