Fig. 4
Download original image
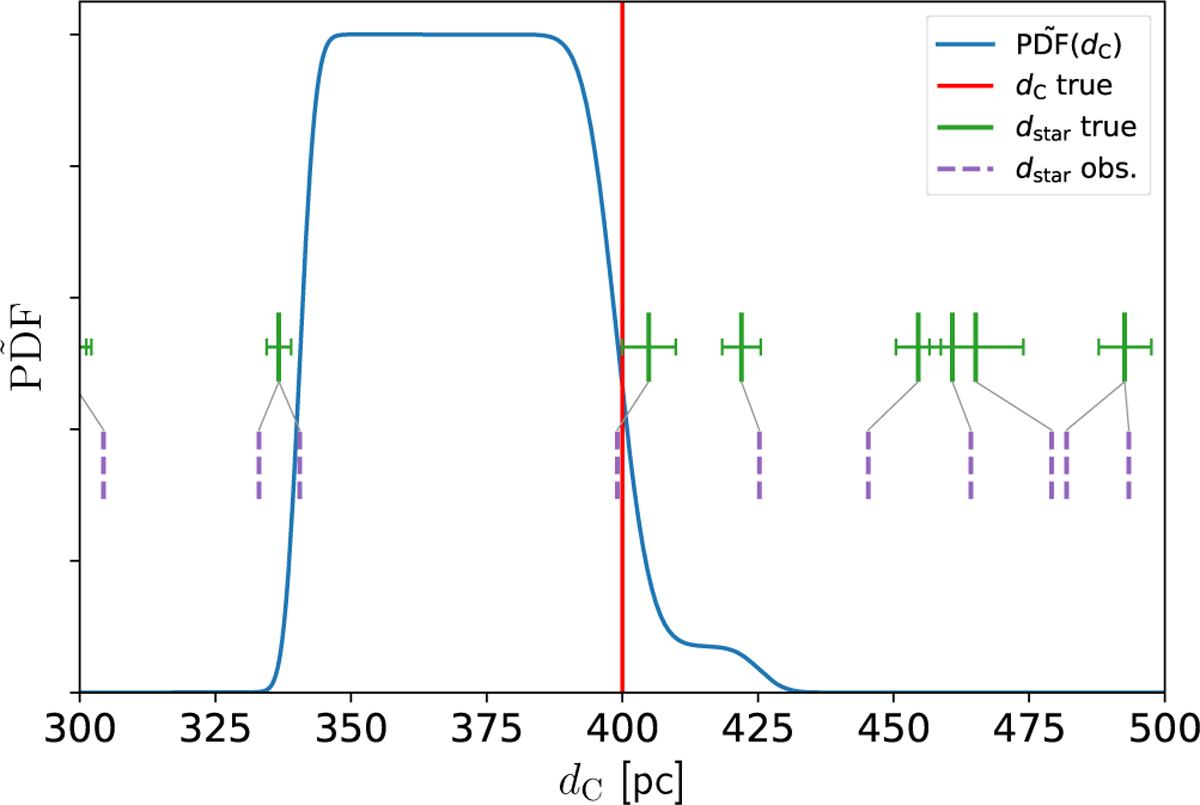
Conditional probability distribution ![]() corresponding to the 1D likelihood scan through ϖC for the one-cloud mock data set using the one-layer model. The vertical (continuous) green and (dashed) purple segments indicate the true and observed distances of the stars, respectively. The gray oblique lines link the two. The green horizontal errorbars indicate the 68% confidence level on star distances obtained from
corresponding to the 1D likelihood scan through ϖC for the one-cloud mock data set using the one-layer model. The vertical (continuous) green and (dashed) purple segments indicate the true and observed distances of the stars, respectively. The gray oblique lines link the two. The green horizontal errorbars indicate the 68% confidence level on star distances obtained from ![]() . The vertical red line indicates the input cloud parallax. Due to randomization on parallaxes, some stars with very similar (true) parallaxes (green) are dispersed.
. The vertical red line indicates the input cloud parallax. Due to randomization on parallaxes, some stars with very similar (true) parallaxes (green) are dispersed.
Current usage metrics show cumulative count of Article Views (full-text article views including HTML views, PDF and ePub downloads, according to the available data) and Abstracts Views on Vision4Press platform.
Data correspond to usage on the plateform after 2015. The current usage metrics is available 48-96 hours after online publication and is updated daily on week days.
Initial download of the metrics may take a while.