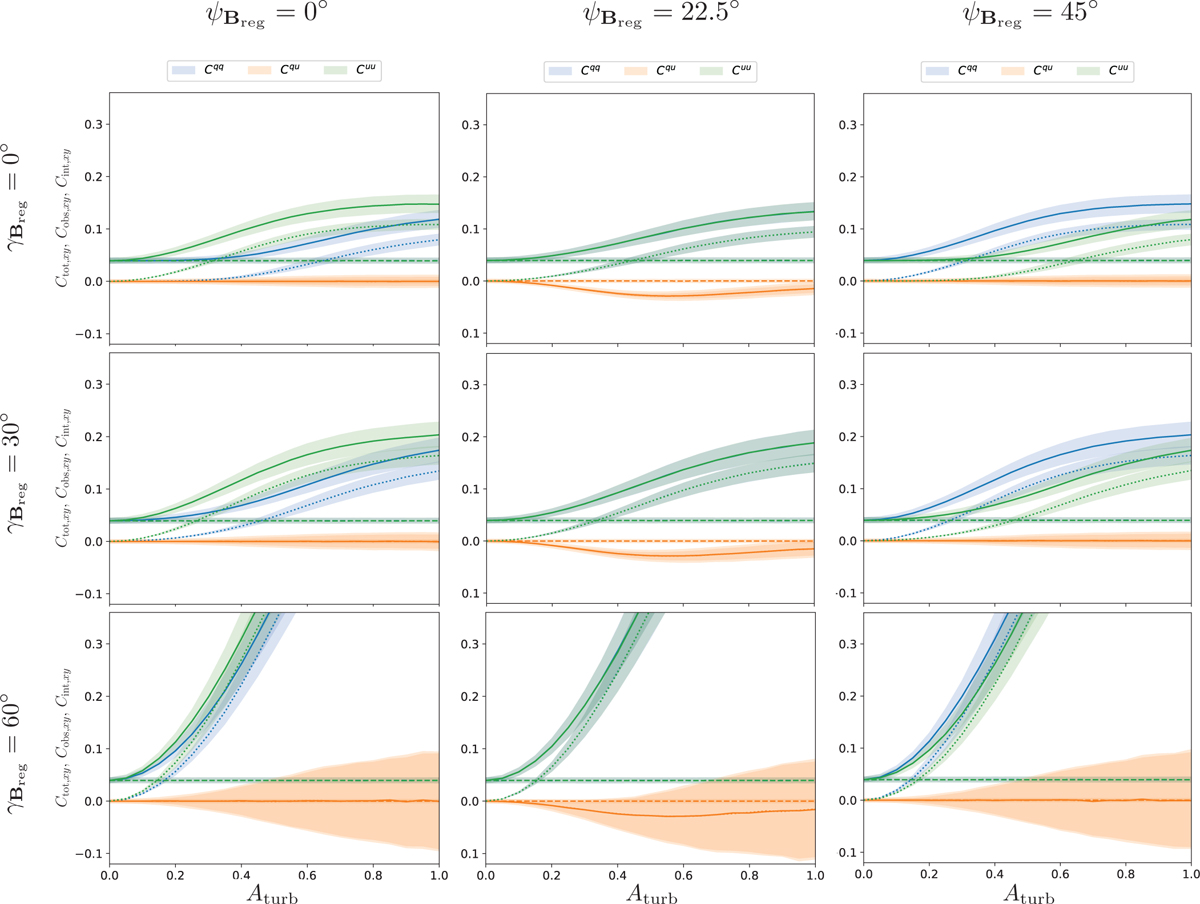
Fig. B.5
Download original image
Comparison of the contributions from the observational noise and from the intrinsic scatter to the different elements of the covariance matrix as a function of the amplitude of the stochastic component and for different configurations of Breg. We show the total elements of the covariance matrix (solid lines) along with the contribution from the noise (dashed lines) and from the intrinsic scatter (dotted lines). Blue, green and orange correspond to Cint,qq, Cint,uu and Cint,qu respectively. The lines and shaded areas show the median and 16 and 84 percentile of the values obtained while repeating the analysis for 10,000 simulations in which both the noise and the intrinsic scatter vary. In this simulation we have set preg = 0.6% and σp = σq = σu = 0.2% corresponding roughly to a S/N of 3 for the individual star polarization measurement.
Current usage metrics show cumulative count of Article Views (full-text article views including HTML views, PDF and ePub downloads, according to the available data) and Abstracts Views on Vision4Press platform.
Data correspond to usage on the plateform after 2015. The current usage metrics is available 48-96 hours after online publication and is updated daily on week days.
Initial download of the metrics may take a while.