Fig. B.3
Download original image
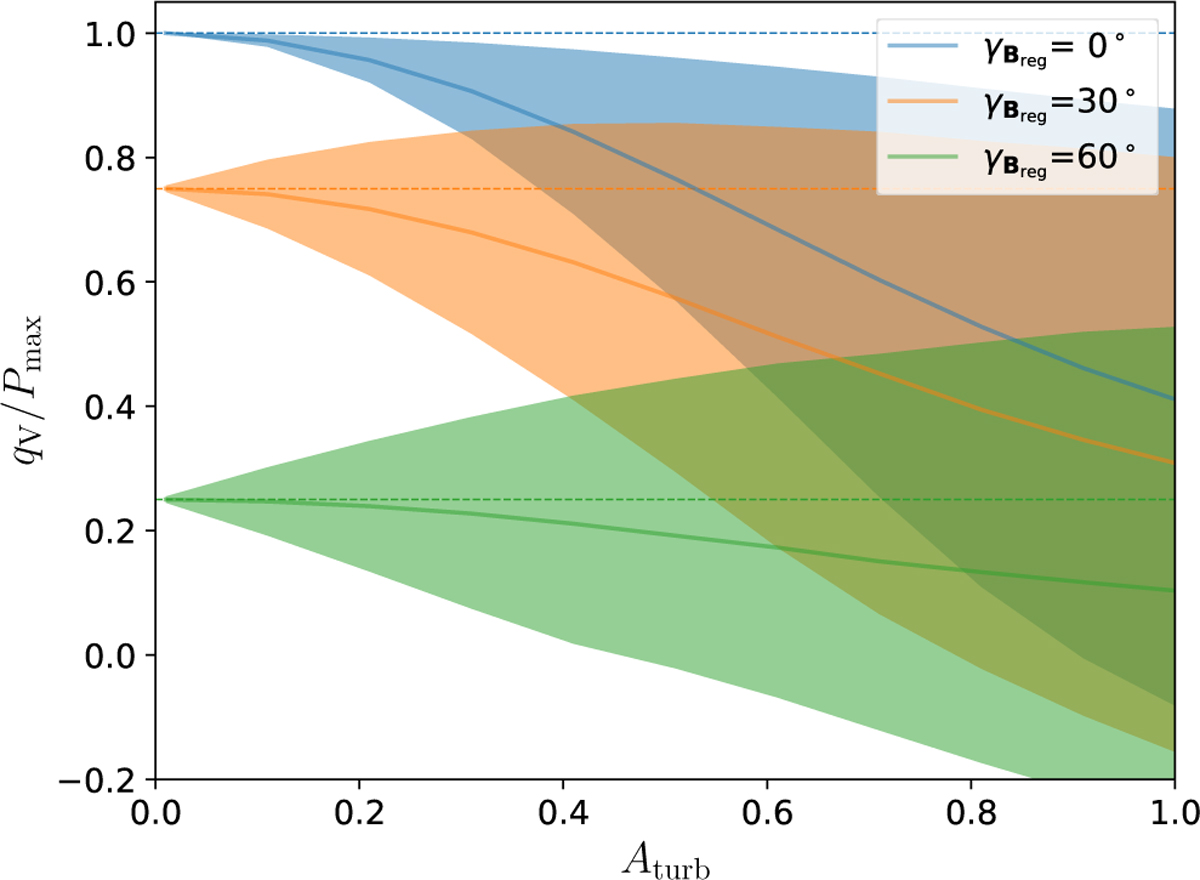
Distributions of qV/Pmax corresponding to various inclination angle and amplitude of the intrinsic scatter. We carry the analysis out for ![]() , 30°, and 60° and Aturb ∊ [0, 1]. For each value pair, 105 realizations of Btot are computed and qV is evaluated. The continuous lines show the mean of the distribution for
, 30°, and 60° and Aturb ∊ [0, 1]. For each value pair, 105 realizations of Btot are computed and qV is evaluated. The continuous lines show the mean of the distribution for ![]() , 30°, and 60° in blue, orange and green, respectively. The shaded areas indicate the range span between percentiles 16 and 84 of the distribution. The dashed lines indicate the qv/Pmax values obtained when no stochastic term is added in the magnetic field.
, 30°, and 60° in blue, orange and green, respectively. The shaded areas indicate the range span between percentiles 16 and 84 of the distribution. The dashed lines indicate the qv/Pmax values obtained when no stochastic term is added in the magnetic field.
Current usage metrics show cumulative count of Article Views (full-text article views including HTML views, PDF and ePub downloads, according to the available data) and Abstracts Views on Vision4Press platform.
Data correspond to usage on the plateform after 2015. The current usage metrics is available 48-96 hours after online publication and is updated daily on week days.
Initial download of the metrics may take a while.