Fig. 2
Download original image
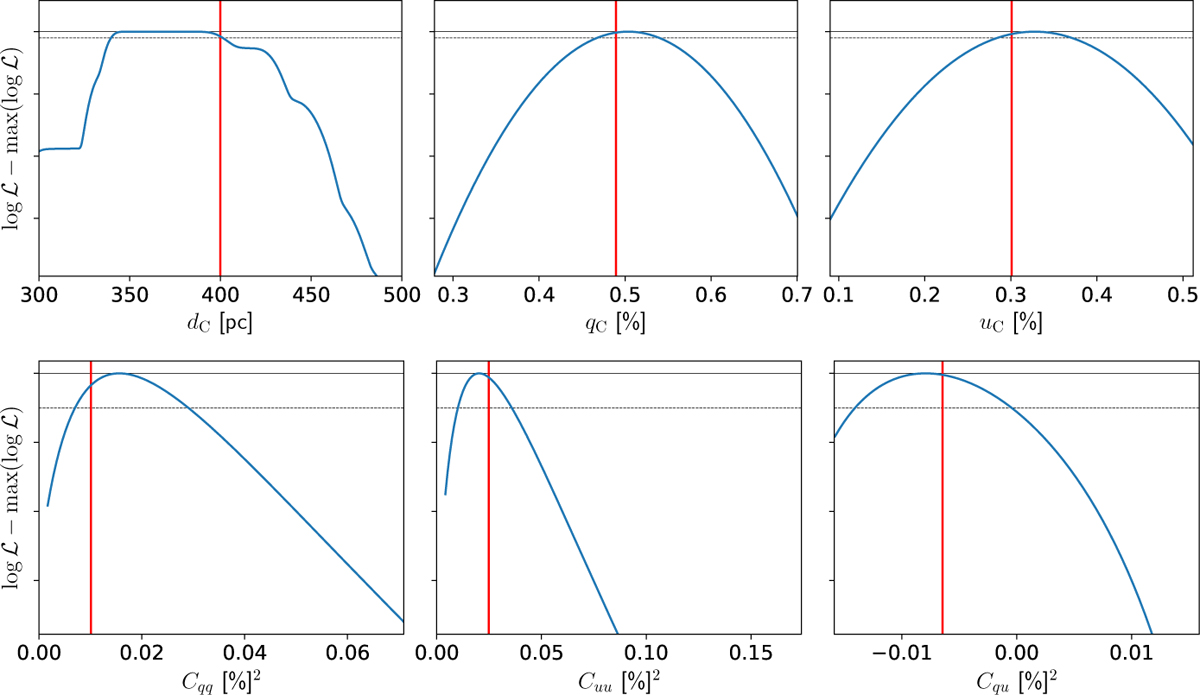
Curves of (log(ℒ) − max(log(ℒ))) corresponding to 1D likelihood scans through the parameter space for the mock data set with a single cloud along the LOS. For each scan only the explored parameter varies, while all other parameters are kept fixed to their true values. The log-likelihood (log(ℒ)) is estimated at each point. The horizontal solid and dashed lines show the values of 0 and −1, respectively, providing an approximate estimate of the location of the 68 per cent credible interval. In the top (bottom) row the vertical axis ranges from −40 to 5 (−7.5 to 0.3). The red vertical line on each panel indicates the so-called true value reported in Table 1.
Current usage metrics show cumulative count of Article Views (full-text article views including HTML views, PDF and ePub downloads, according to the available data) and Abstracts Views on Vision4Press platform.
Data correspond to usage on the plateform after 2015. The current usage metrics is available 48-96 hours after online publication and is updated daily on week days.
Initial download of the metrics may take a while.