Fig. 15
Download original image
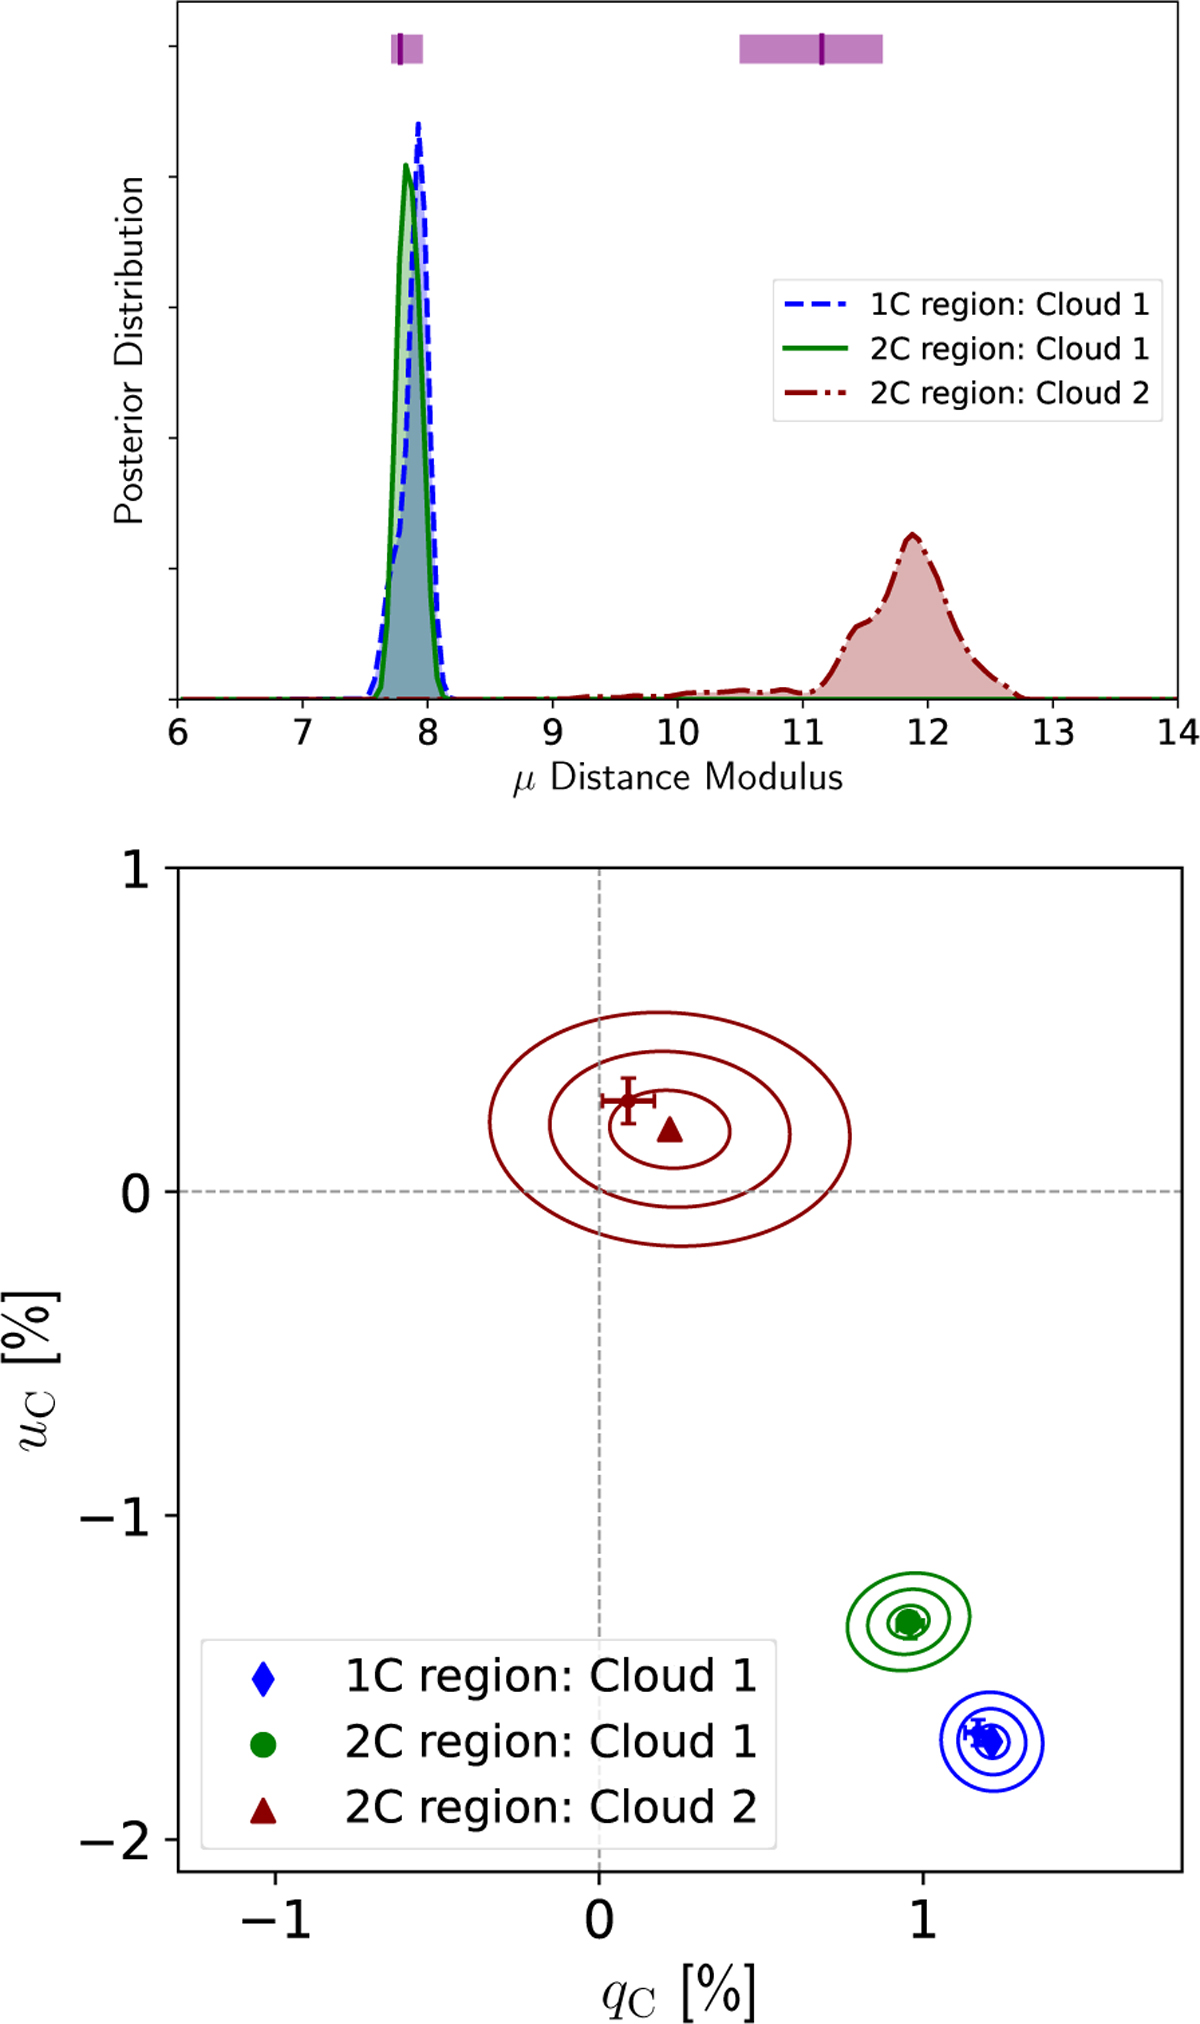
Posterior distributions for the cloud distance modulus (top) and cloud mean polarization (bottom) obtained for the 1-cloud region while fitted with the one-layer model (blue) and for the 2-cloud region while fitted with the two-layer model with posteriors in green and dark red for the nearby and faraway cloud, respectively. The contours indicate the 1, 2, and 3σ confidence levels. The values obtained by Panopoulou et al. (2019b) are reported, using purple horizontal bands for the distance modulus on the top panel and errorbars to report polarization in the bottom panel using the same colors as for the confidence contours we obtain. Values for the 2-cloud region correspond to their distance cut that maximizes the detection of the faraway cloud.
Current usage metrics show cumulative count of Article Views (full-text article views including HTML views, PDF and ePub downloads, according to the available data) and Abstracts Views on Vision4Press platform.
Data correspond to usage on the plateform after 2015. The current usage metrics is available 48-96 hours after online publication and is updated daily on week days.
Initial download of the metrics may take a while.