Fig. 10
Download original image
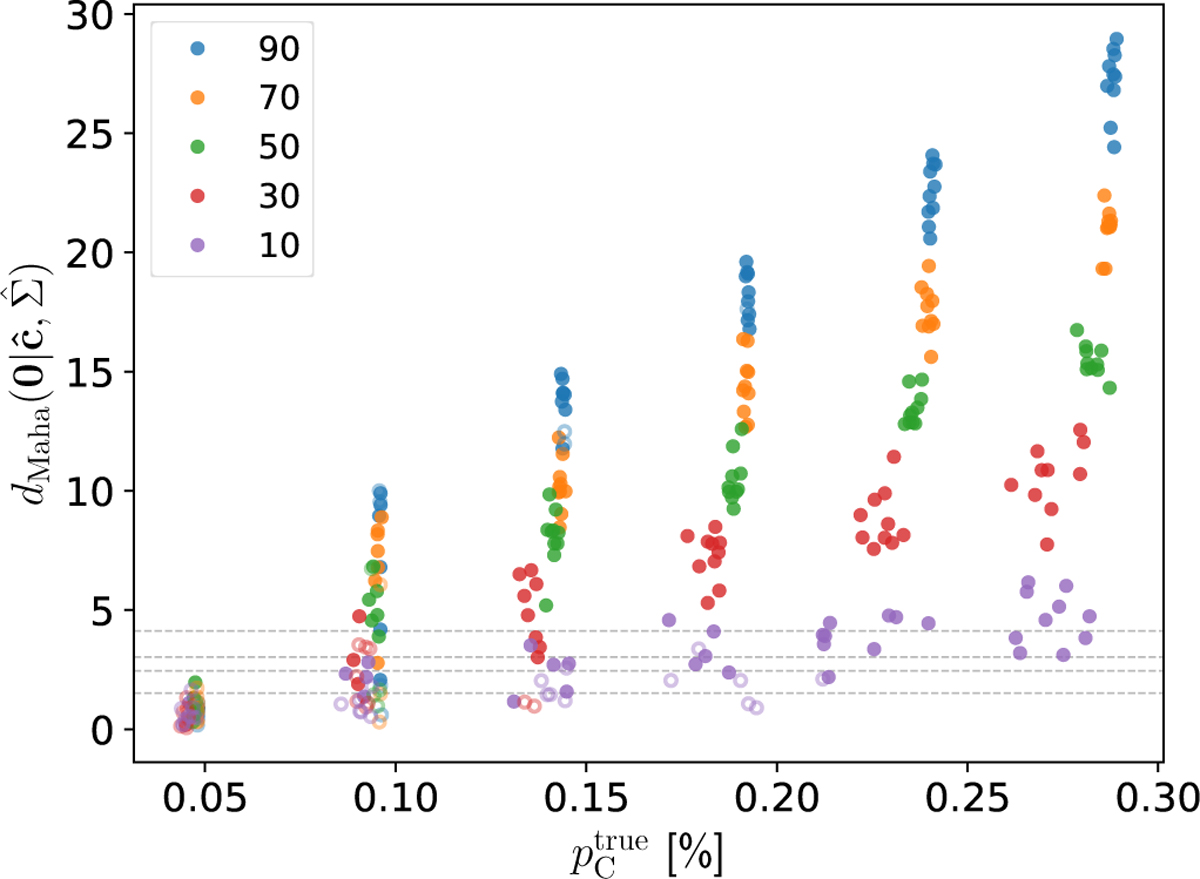
Significance of the cloud detection ![]() as a function of the input cloud polarization and for the several fbg values corresponding to the same reconstructions characterized through Fig. 9. The horizontal lines indicate threshold values corresponding to detection levels with 68%, 95%, 99%, and 99.98% probabilities of finding a distance lower than threshold. Symbol and color conventions are the same as in Fig. 9.
as a function of the input cloud polarization and for the several fbg values corresponding to the same reconstructions characterized through Fig. 9. The horizontal lines indicate threshold values corresponding to detection levels with 68%, 95%, 99%, and 99.98% probabilities of finding a distance lower than threshold. Symbol and color conventions are the same as in Fig. 9.
Current usage metrics show cumulative count of Article Views (full-text article views including HTML views, PDF and ePub downloads, according to the available data) and Abstracts Views on Vision4Press platform.
Data correspond to usage on the plateform after 2015. The current usage metrics is available 48-96 hours after online publication and is updated daily on week days.
Initial download of the metrics may take a while.