Fig. 1
Download original image
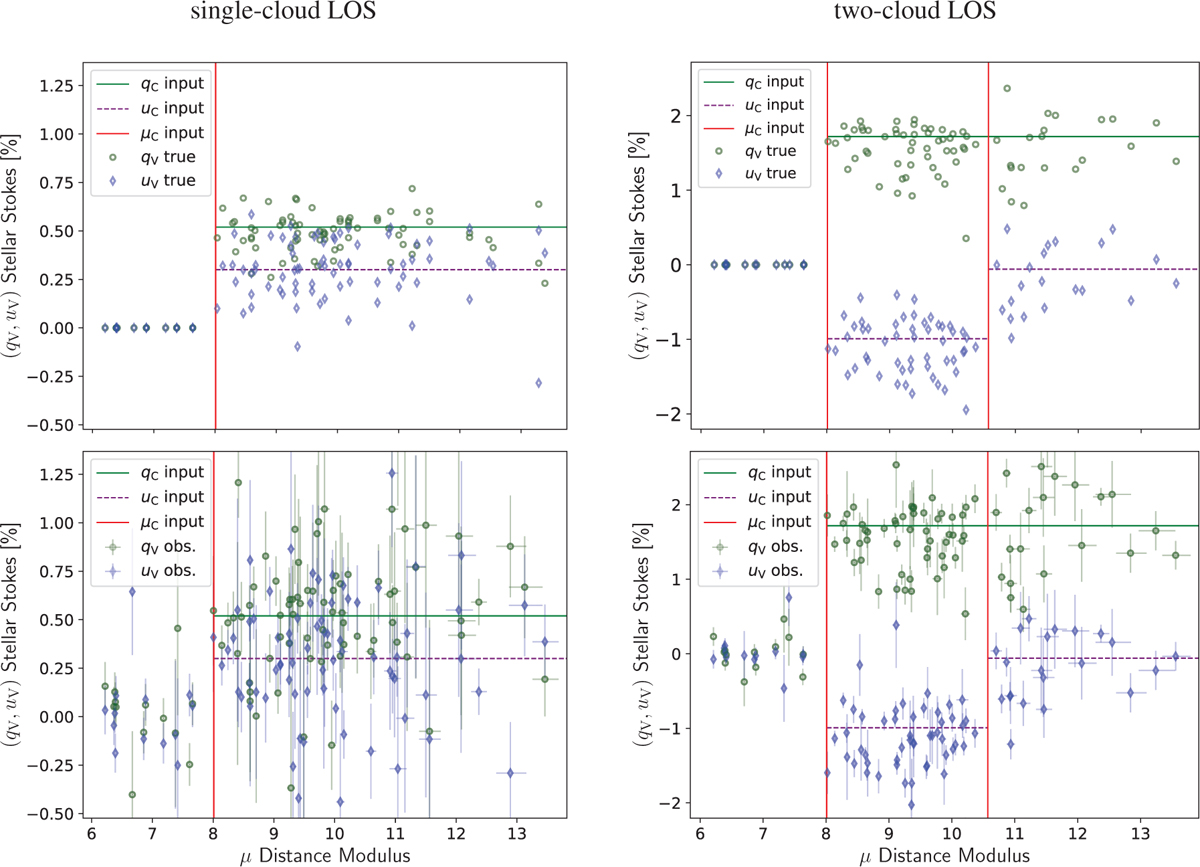
Example of a single-cloud (left) and two-cloud (right) simulated data set. We show the stellar qV (green circles) and uV (blue diamonds) Stokes parameters as a function of distance modulus (μi) Top and bottom panels show the same data set. Top panels do not include observational noise (they are the “true” data points) while bottom panels do include uncertainties in both parallax and polarization (shown with errorbars). The vertical red lines indicate the input distance modulus of the clouds. The horizontal green and dashed-purple lines indicate the input (cumulative) mean Stokes parameters (qC and uC, respectively) before the inclusion of intrinsic scatter and observational noise, i.e., ![]() in Eq. (1).
in Eq. (1).
Current usage metrics show cumulative count of Article Views (full-text article views including HTML views, PDF and ePub downloads, according to the available data) and Abstracts Views on Vision4Press platform.
Data correspond to usage on the plateform after 2015. The current usage metrics is available 48-96 hours after online publication and is updated daily on week days.
Initial download of the metrics may take a while.