Open Access
Fig. 8
Download original image
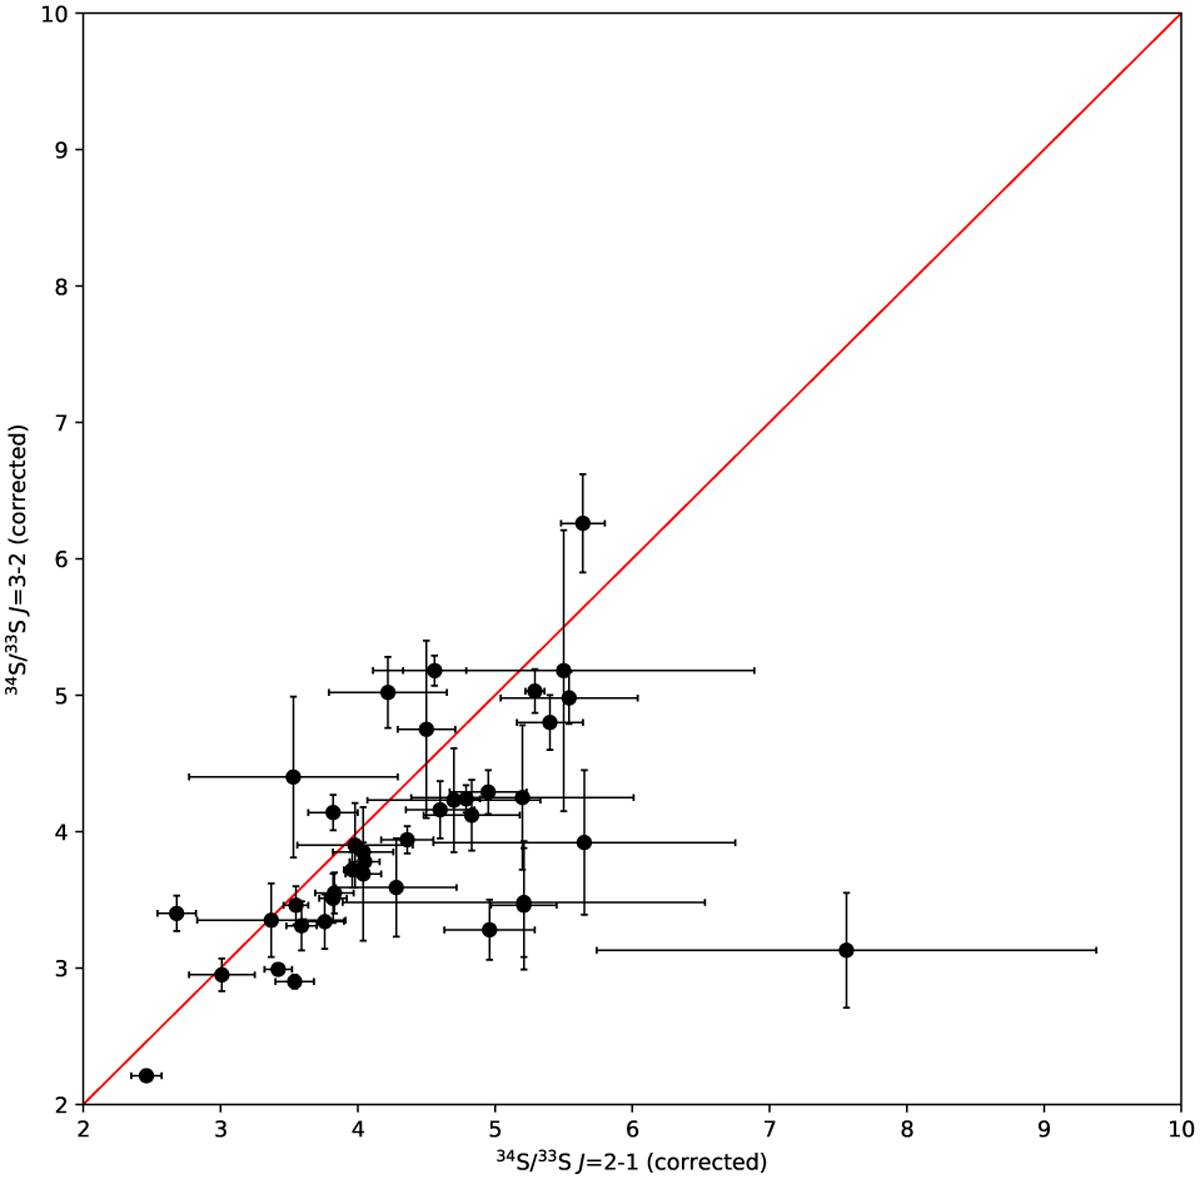
Comparison of 34S/33S ratios between the J = 2−1 and 3−2 data. The J = 2−1 ratios are opacity corrected, while the same correction factors were also applied to the J = 3−2 data. The red solid line indicates that the 34S/33S ratios are equal in these two transitions.
Current usage metrics show cumulative count of Article Views (full-text article views including HTML views, PDF and ePub downloads, according to the available data) and Abstracts Views on Vision4Press platform.
Data correspond to usage on the plateform after 2015. The current usage metrics is available 48-96 hours after online publication and is updated daily on week days.
Initial download of the metrics may take a while.