Fig. 7
Download original image
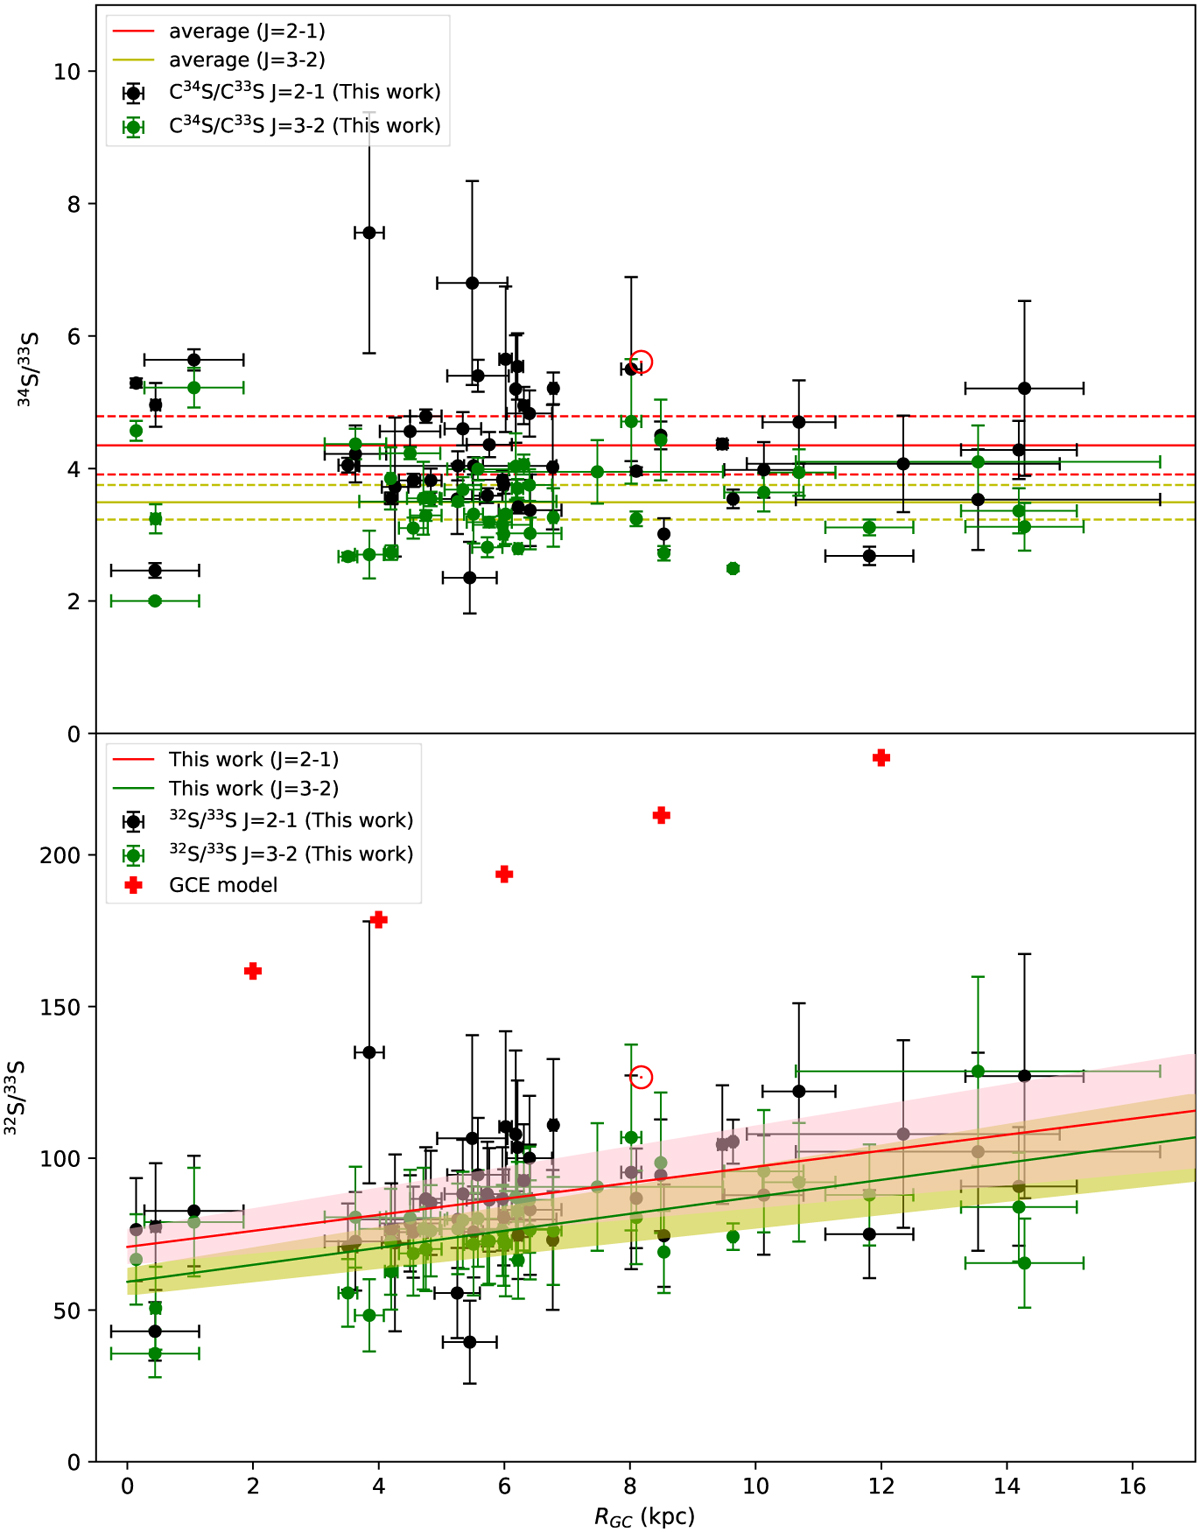
34S/33S and 32S/33S isotope ratios (for the latter, see Eqs. (12) and (13)) plotted as functions of the distance from the Galactic center. Top: 34S/33S ratios derived from C34S/C33S in the J = 2−1 and J = 3−2 transitions plotted as black and green dots, respectively. The red solid and the two dashed lines show the average value and its standard deviation, 4.35 ± 0.44, of 34S/33S with corrections of optical depth toward our sample in the J = 2−1 transition. The yellow solid and the two dashed lines show the average value and its standard deviation, 3.49 ± 0.26, of 34S/33S toward our sample in the J = 3−2 transition. The red symbol ⊙ indicates the 34S/33S isotope ratio in the Solar System. Bottom: Black and green dots show the 32S/33S ratios in the J = 2−1 and J = 3−2 transitions, respectively. The red symbol ⊙ indicates the 32S/33S value in the Solar System. The resulting first-order polynomial fits to the 32S/33S ratios in the J = 2−1 and J = 3−2 transitions in this work are plotted as red and green solid lines, respectively, with the pink and yellow shaded area showing the 1 σ standard deviations. The red crosses are the results from the GCE model of Kobayashi et al. (2011, 2020, see also Sect. 4.9).
Current usage metrics show cumulative count of Article Views (full-text article views including HTML views, PDF and ePub downloads, according to the available data) and Abstracts Views on Vision4Press platform.
Data correspond to usage on the plateform after 2015. The current usage metrics is available 48-96 hours after online publication and is updated daily on week days.
Initial download of the metrics may take a while.