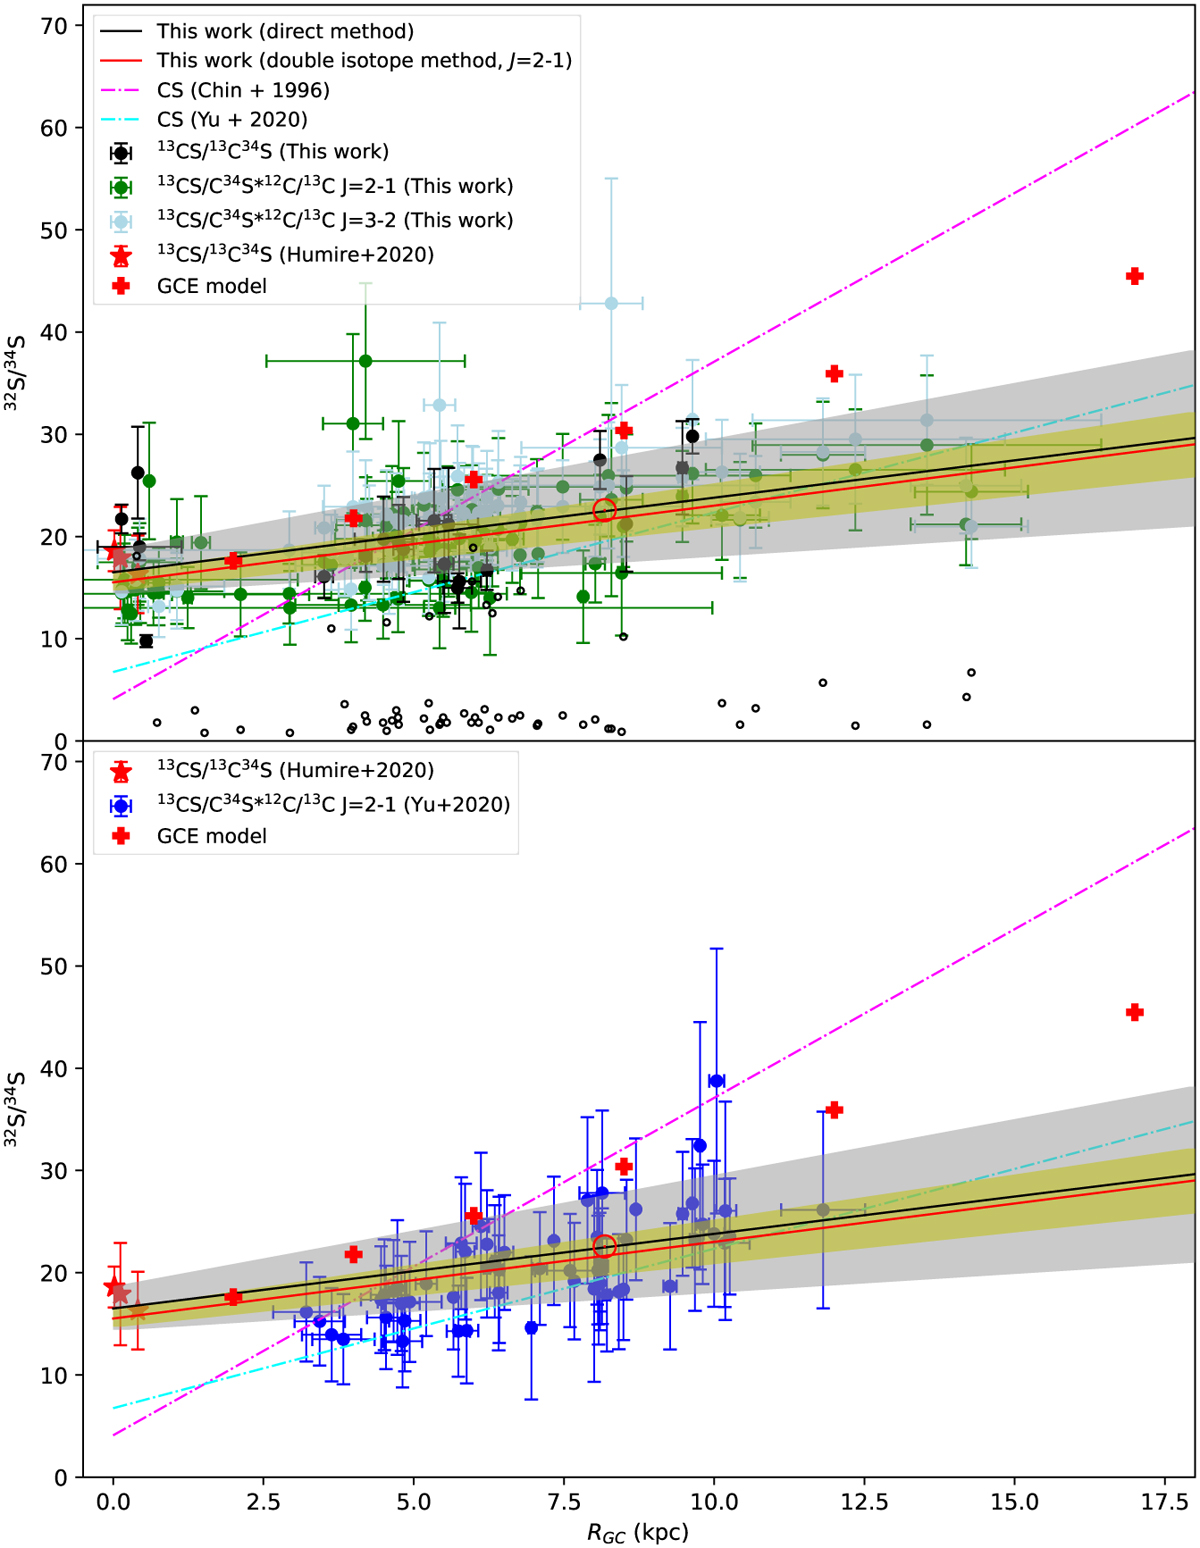
Fig. 4
Download original image
32S/34S isotope ratios as functions of the distance from the Galactic center. The symbol ⊙ indicates the 32S/34S isotope ratio in the Solar System. In the upper panel, the 32S/34S ratios directly derived from 13CS/13C34S in the J = 2−1 transition and obtained from the double isotope method in the J = 2−1 transition with corrections for optical depth are plotted as black and green dots, respectively. The 32S/34S ratios without corrections of opacity in the J = 3−2 transition are plotted as light blue dots. The 3σ lower limits of 32S/34S ratios obtained from non-detections of 13C34S in the current work are shown as open black circles. The 32S/34S ratios in Yu et al. (2020) derived from the double isotope method in the J = 2−1 transitions are shown as blue dots in the lower panel. The 32S/34S values in the CMZ obtained from 13CS/13C34S in Humire et al. (2020) are plotted as red stars in both panels. The resulting first-order polynomial fits to 32S/34S ratios with the direct method and the double isotope method from the J = 2−1 transition in this work are plotted as black and red solid lines in the two panels, respectively, with the gray and yellow shaded areas showing the 1 σ intervals of the fits. The magenta and cyan dashed-dotted lines show the 32S/34S gradients from Chin et al. (1996) and Yu et al. (2020). The red crosses visualize the results from the GCE model of Kobayashi et al. (2011, 2020, see also Sect. 4.9).
Current usage metrics show cumulative count of Article Views (full-text article views including HTML views, PDF and ePub downloads, according to the available data) and Abstracts Views on Vision4Press platform.
Data correspond to usage on the plateform after 2015. The current usage metrics is available 48-96 hours after online publication and is updated daily on week days.
Initial download of the metrics may take a while.