Fig. 3
Download original image
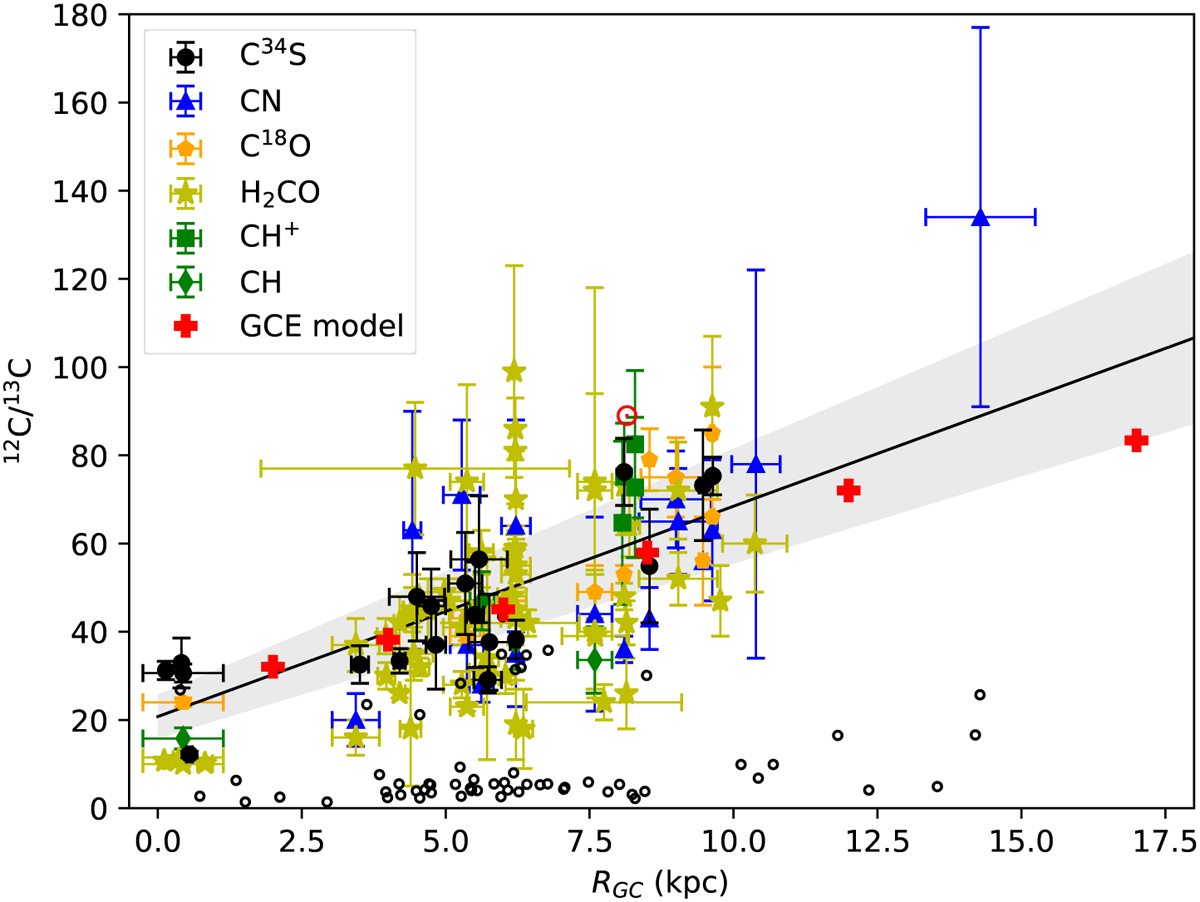
12C/13C isotope ratios from C34S/13C34S, CN/13CN, C18O/13C18O, ![]() , CH+/ 13CH+, and CH/13CH are plotted as functions of the distance from the Galactic center. The red symbol ⊙ indicates the 12C/13C isotope ratio of the Sun. The filled black circles are the results obtained from C34S with corrections of opacity in the current work, and the resulting first-order polynomial fit is plotted as a solid line, with the gray-shaded area showing the 1σ interval of the fit. The open black circles are the 3σ lower limits obtained from nondetections of 13C34S in the current work. The blue triangles, orange pentagons, yellow stars, green squares, and green diamonds are values determined from CN (Savage et al. 2002; Milam et al. 2005), C18O (Langer & Penzias 1990; Wouterloot & Brand 1996; Keene et al. 1998), H2CO (Henkel et al. 1980, 1982, 1983, 1985; Yan et al. 2019), CH+ (Ritchey et al. 2011), and CH (Jacob et al. 2020), respectively, using the most up-to-date distances. The red crosses visualize the results from the GCE model of Kobayashi et al. (2011, 2020, see also Sect. 4.9).
, CH+/ 13CH+, and CH/13CH are plotted as functions of the distance from the Galactic center. The red symbol ⊙ indicates the 12C/13C isotope ratio of the Sun. The filled black circles are the results obtained from C34S with corrections of opacity in the current work, and the resulting first-order polynomial fit is plotted as a solid line, with the gray-shaded area showing the 1σ interval of the fit. The open black circles are the 3σ lower limits obtained from nondetections of 13C34S in the current work. The blue triangles, orange pentagons, yellow stars, green squares, and green diamonds are values determined from CN (Savage et al. 2002; Milam et al. 2005), C18O (Langer & Penzias 1990; Wouterloot & Brand 1996; Keene et al. 1998), H2CO (Henkel et al. 1980, 1982, 1983, 1985; Yan et al. 2019), CH+ (Ritchey et al. 2011), and CH (Jacob et al. 2020), respectively, using the most up-to-date distances. The red crosses visualize the results from the GCE model of Kobayashi et al. (2011, 2020, see also Sect. 4.9).
Current usage metrics show cumulative count of Article Views (full-text article views including HTML views, PDF and ePub downloads, according to the available data) and Abstracts Views on Vision4Press platform.
Data correspond to usage on the plateform after 2015. The current usage metrics is available 48-96 hours after online publication and is updated daily on week days.
Initial download of the metrics may take a while.