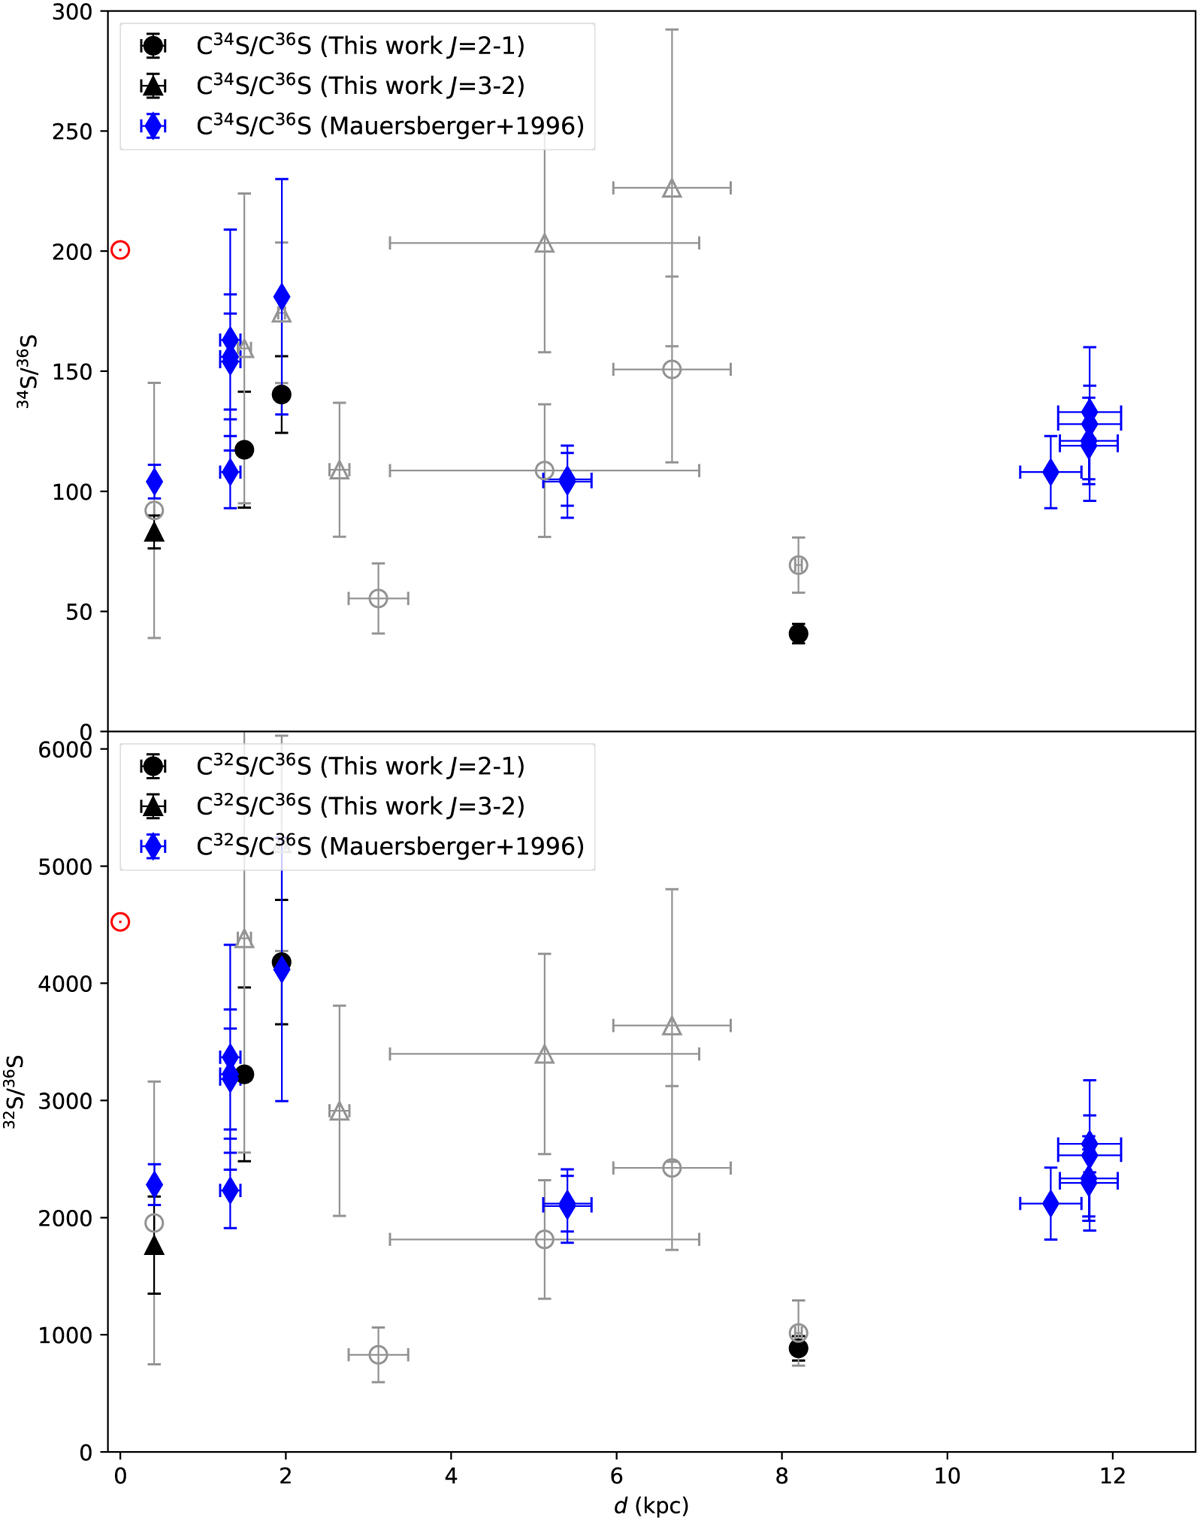
Fig. B.5
Download original image
34S/36S and 32S/36S isotope ratios plotted as functions of the distance from the Sun. Top: Filled black circles and filled black triangle present the 34S/36S ratios in the J = 2−1 and J = 3−2 transitions derived from C34S/C36S in this work with detections of C36S, respectively. The open gray circles and open gray triangles present the 34S/36S ratios in the J = 2−1 and J = 3−2 transitions derived from C34S/C36S in this work with tentative detections of C36S, respectively. The blue diamonds show the 34S/36S ratios in Mauersberger et al. (1996). The red symbol ⊙ indicates the 34S/36S isotope ratio in the Solar System. Bottom: 32S/36S ratios obtained from 34S/36S ratios combined with the 32S/34S ratios derived in this work. The filled black circles and filled black triangle present the values in the J = 2−1 and J = 3−2 transitions from this work with detections of C36S, respectively. The open gray circles and open gray triangles present the ratios in the J = 2−1 and J = 3−2 transitions derived from this work with tentative detections of C36S, respectively. The 32S/36S ratios, derived with 34S/36S values in Mauersberger et al. (1996) and the 32S/34S gradient in this work, are plotted as blue diamonds. The red symbol ⊙ indicates the 32S/36S isotope ratio in the Solar System.
Current usage metrics show cumulative count of Article Views (full-text article views including HTML views, PDF and ePub downloads, according to the available data) and Abstracts Views on Vision4Press platform.
Data correspond to usage on the plateform after 2015. The current usage metrics is available 48-96 hours after online publication and is updated daily on week days.
Initial download of the metrics may take a while.