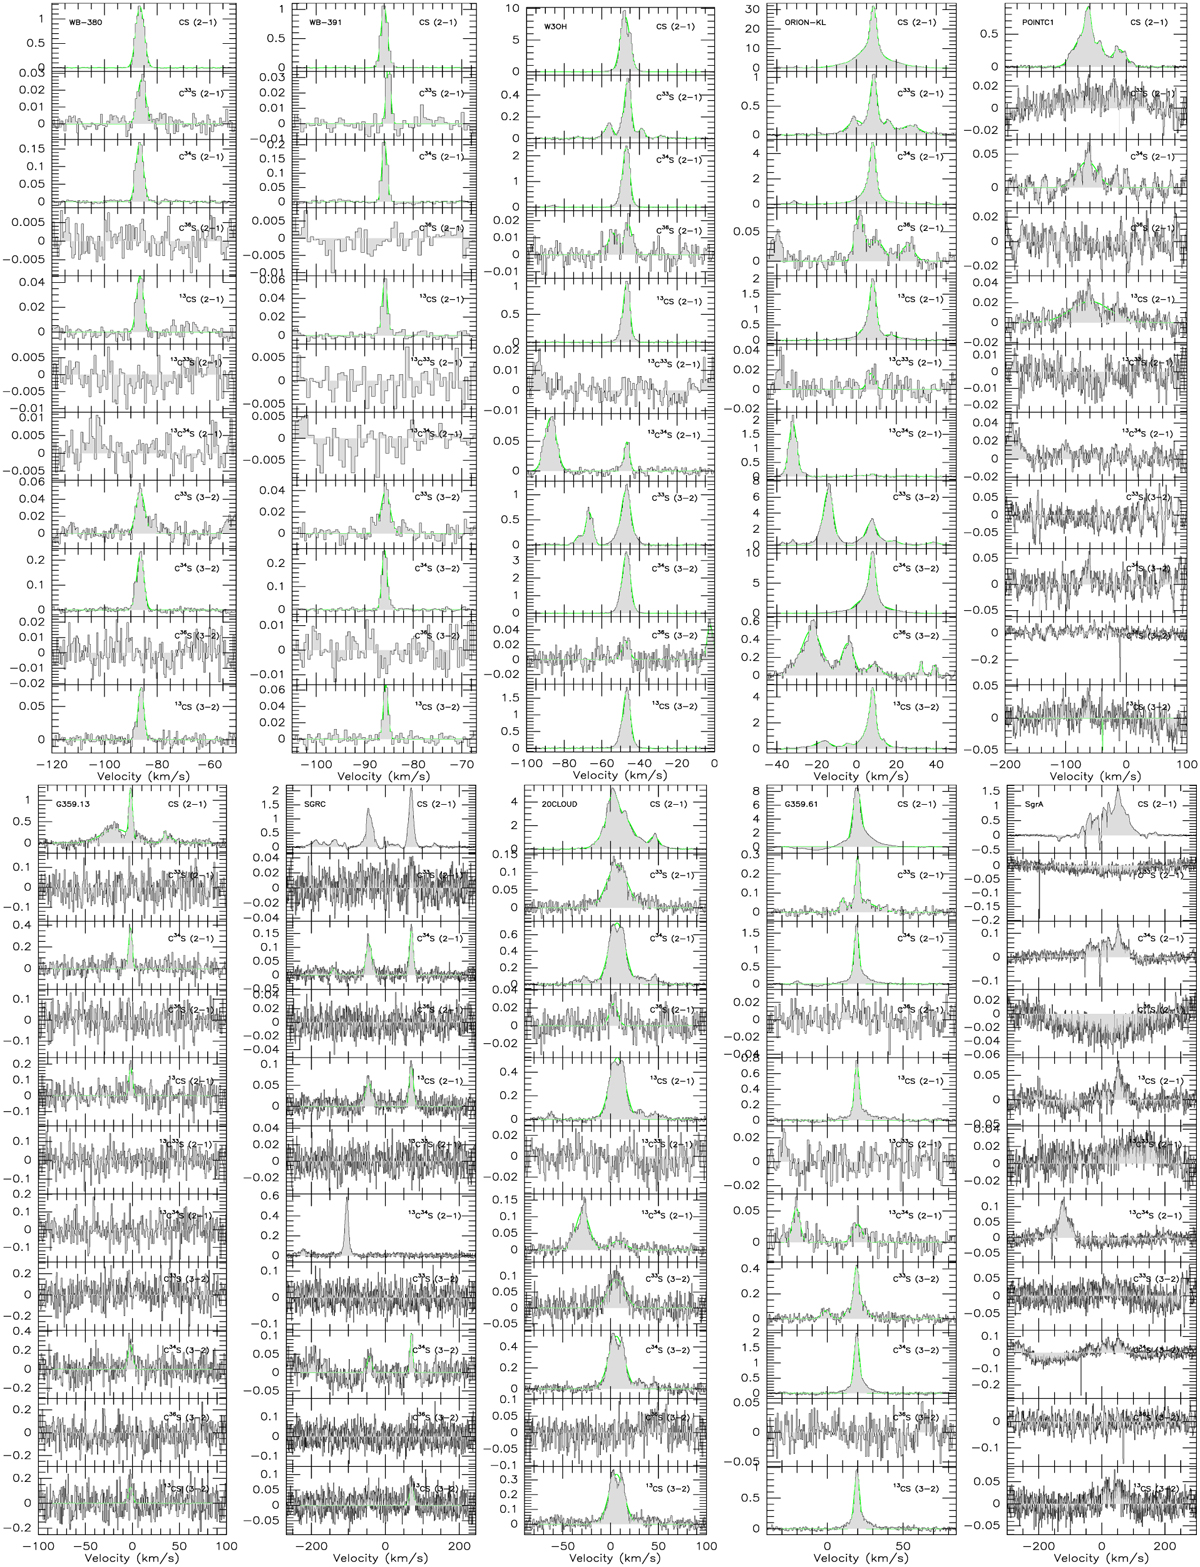
Fig. B.1
Download original image
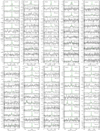
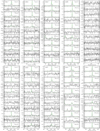
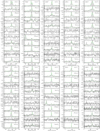
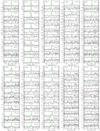
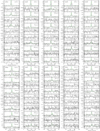
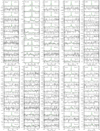
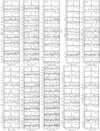
Line profiles of the J = 2−1 transitions of CS, C33S, C34S, C36S, 13CS, 13C33S and 13C34S as well as the J = 3−2 transitions of C33S, C34S, C36S, and 13CS toward 110 targets of our sample, after subtracting first-order polynomial baselines. The main beam temperature scales are presented on the left hand side of the profiles.
Current usage metrics show cumulative count of Article Views (full-text article views including HTML views, PDF and ePub downloads, according to the available data) and Abstracts Views on Vision4Press platform.
Data correspond to usage on the plateform after 2015. The current usage metrics is available 48-96 hours after online publication and is updated daily on week days.
Initial download of the metrics may take a while.