Fig. 13
Download original image
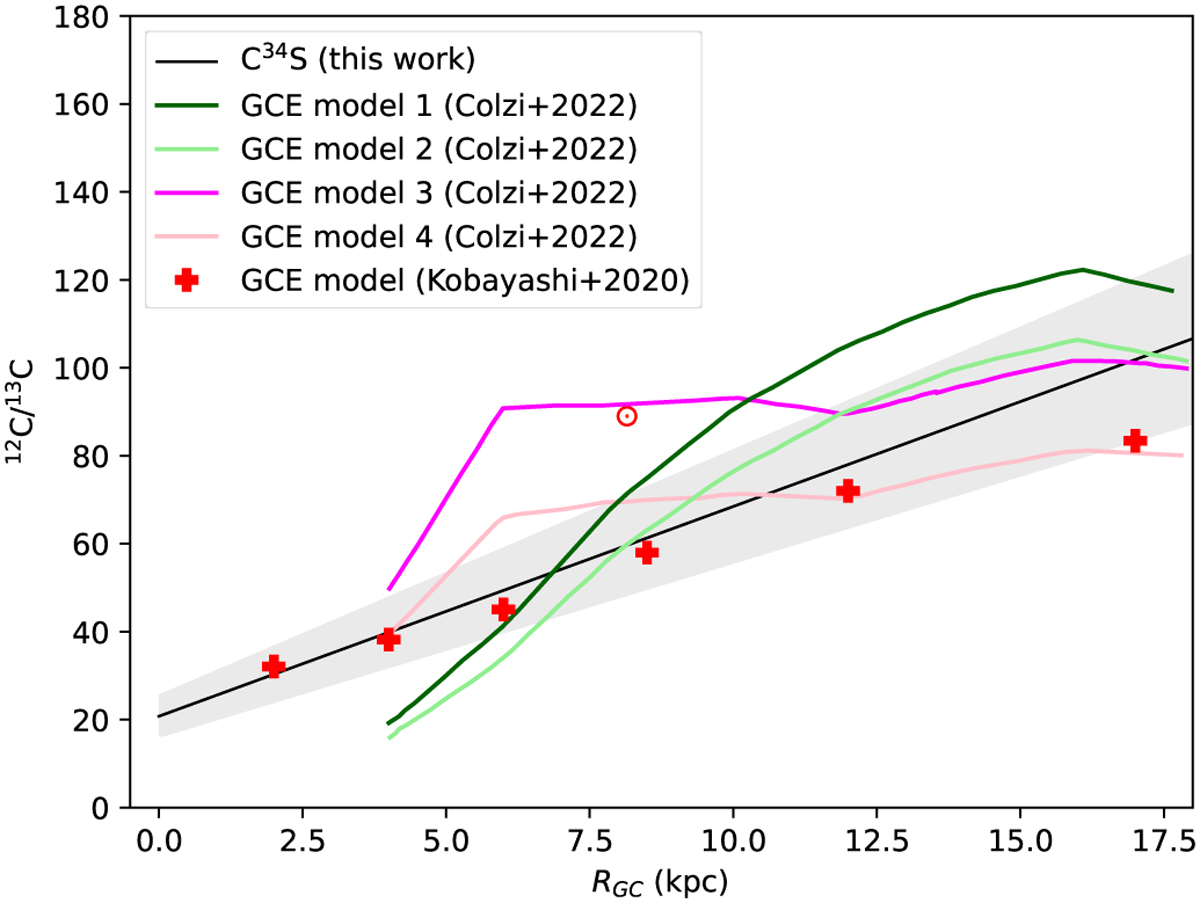
12C/13C isotope ratios from observations in this work and GCE models. The red symbol ⊙ indicates the 12C/13C isotope ratio of the Sun. The 12C/13C gradient obtained from C34S in the current work is plotted as a black solid line, with the gray shaded area showing the 1 σ interval of the fit. The red crosses visualize the results from the GCE model of Kobayashi et al. (2011, 2020, see also Sect. 4.9). The dark green, light green, magenta, and pink lines refer to the predicted gradients from models in Table 2 from Colzi et al. (2022).
Current usage metrics show cumulative count of Article Views (full-text article views including HTML views, PDF and ePub downloads, according to the available data) and Abstracts Views on Vision4Press platform.
Data correspond to usage on the plateform after 2015. The current usage metrics is available 48-96 hours after online publication and is updated daily on week days.
Initial download of the metrics may take a while.