Fig. 10
Download original image
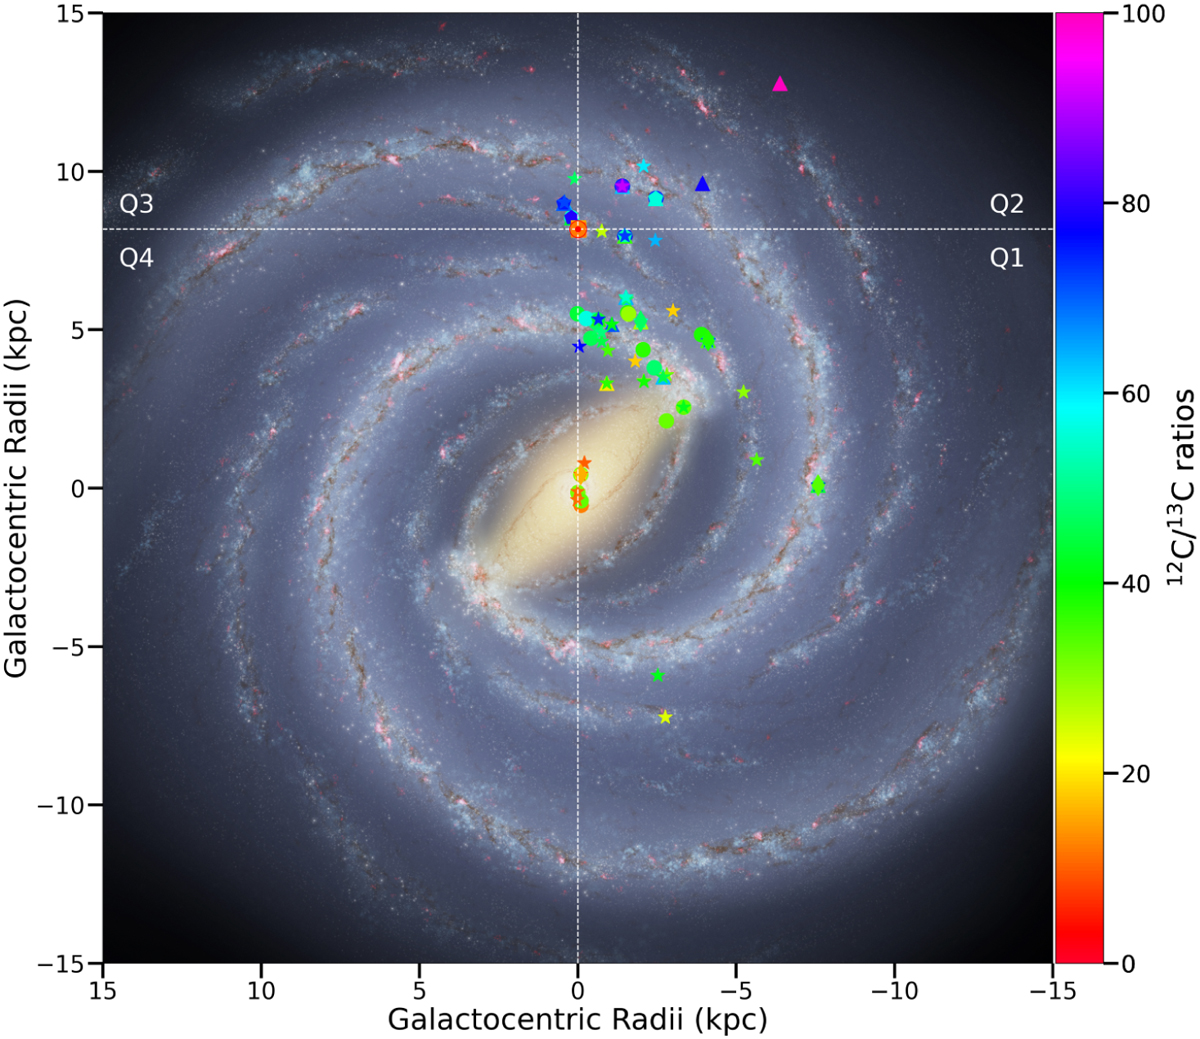
Distribution of 12C/13C ratios from 93 sources in the Milky Way. The background image is the structure of the Milky Way from the artist's impression [Credit: NASA/JPL-Caltech/ESO/R. Hurt]. The 12C/13C isotope ratios with corrections for optical depth from C34S/13C34S in this work are plotted as circles. The triangles, pentagons, stars, squares, and diamonds indicate the 12C/13C ratios derived from CN/13CN (Savage et al. 2002; Milam et al. 2005), C18O/13C18O (Langer & Penzias 1990; Wouterloot & Brand 1996; Keene et al. 1998), ![]() (Henkel et al. 1980, 1982, 1983, 1985; Yan et al. 2019), CH+/13CH+ (Ritchey et al. 2011), and CH/13CH (Jacob et al. 2020), respectively. The red symbol ⊙ indicates the position of the Sun. The colorbar on the right-hand side indicates the range of the 12C/13C ratios.
(Henkel et al. 1980, 1982, 1983, 1985; Yan et al. 2019), CH+/13CH+ (Ritchey et al. 2011), and CH/13CH (Jacob et al. 2020), respectively. The red symbol ⊙ indicates the position of the Sun. The colorbar on the right-hand side indicates the range of the 12C/13C ratios.
Current usage metrics show cumulative count of Article Views (full-text article views including HTML views, PDF and ePub downloads, according to the available data) and Abstracts Views on Vision4Press platform.
Data correspond to usage on the plateform after 2015. The current usage metrics is available 48-96 hours after online publication and is updated daily on week days.
Initial download of the metrics may take a while.