Fig. 3.

Download original image
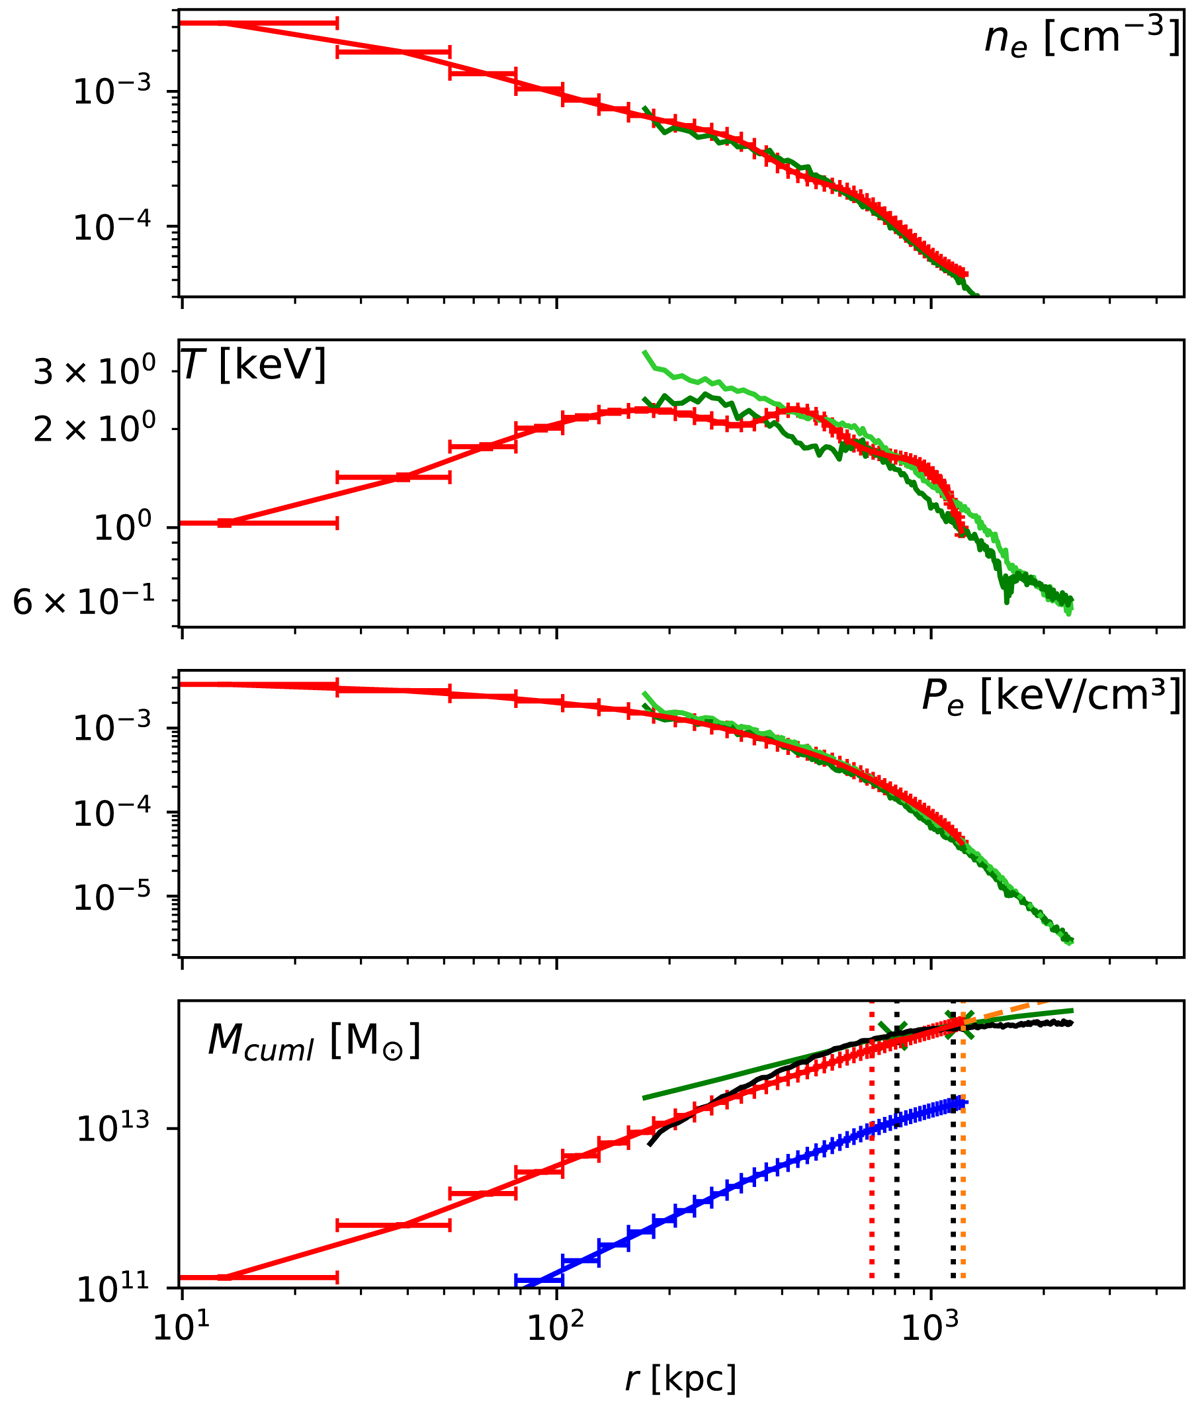
Idealized observations: gas electron density, temperature, electron pressure, and cumulative mass as a function of the radius in physical kiloparsecs for cluster 384 in snap 140. In the first three panels, the red lines show the results of the fit with MBProj2. In the fourth panel, the red line shows the cumulative total mass and the blue line shows the cumulative gas mass according to the fit with MBProj2. The dashed orange line shows the linear extrapolation of the cumulative total mass profile. The green lines show the true profiles according to the simulations (for temperature and pressure: the dark green line represents the spectroscopic-like estimate of the profile (see Sect. 3.5); the light green line represents the mass-weighted profile). In the fourth panel, the green crosses show the true values of the cumulative total mass at the true r500 and r200. The black mass profile shows the hydrostatic mass according to theory (see Sect. 3.6); the green dotted line in the third panel shows the corresponding fit to the pressure profile. The vertical dotted lines in the fourth panel show the calculated values for r500, calculated and r200, calculated (red for the fit with MBProj2, orange for the extrapolation of the fit with MBProj2, and black for the hydrostatic profile according to theory).
Current usage metrics show cumulative count of Article Views (full-text article views including HTML views, PDF and ePub downloads, according to the available data) and Abstracts Views on Vision4Press platform.
Data correspond to usage on the plateform after 2015. The current usage metrics is available 48-96 hours after online publication and is updated daily on week days.
Initial download of the metrics may take a while.


