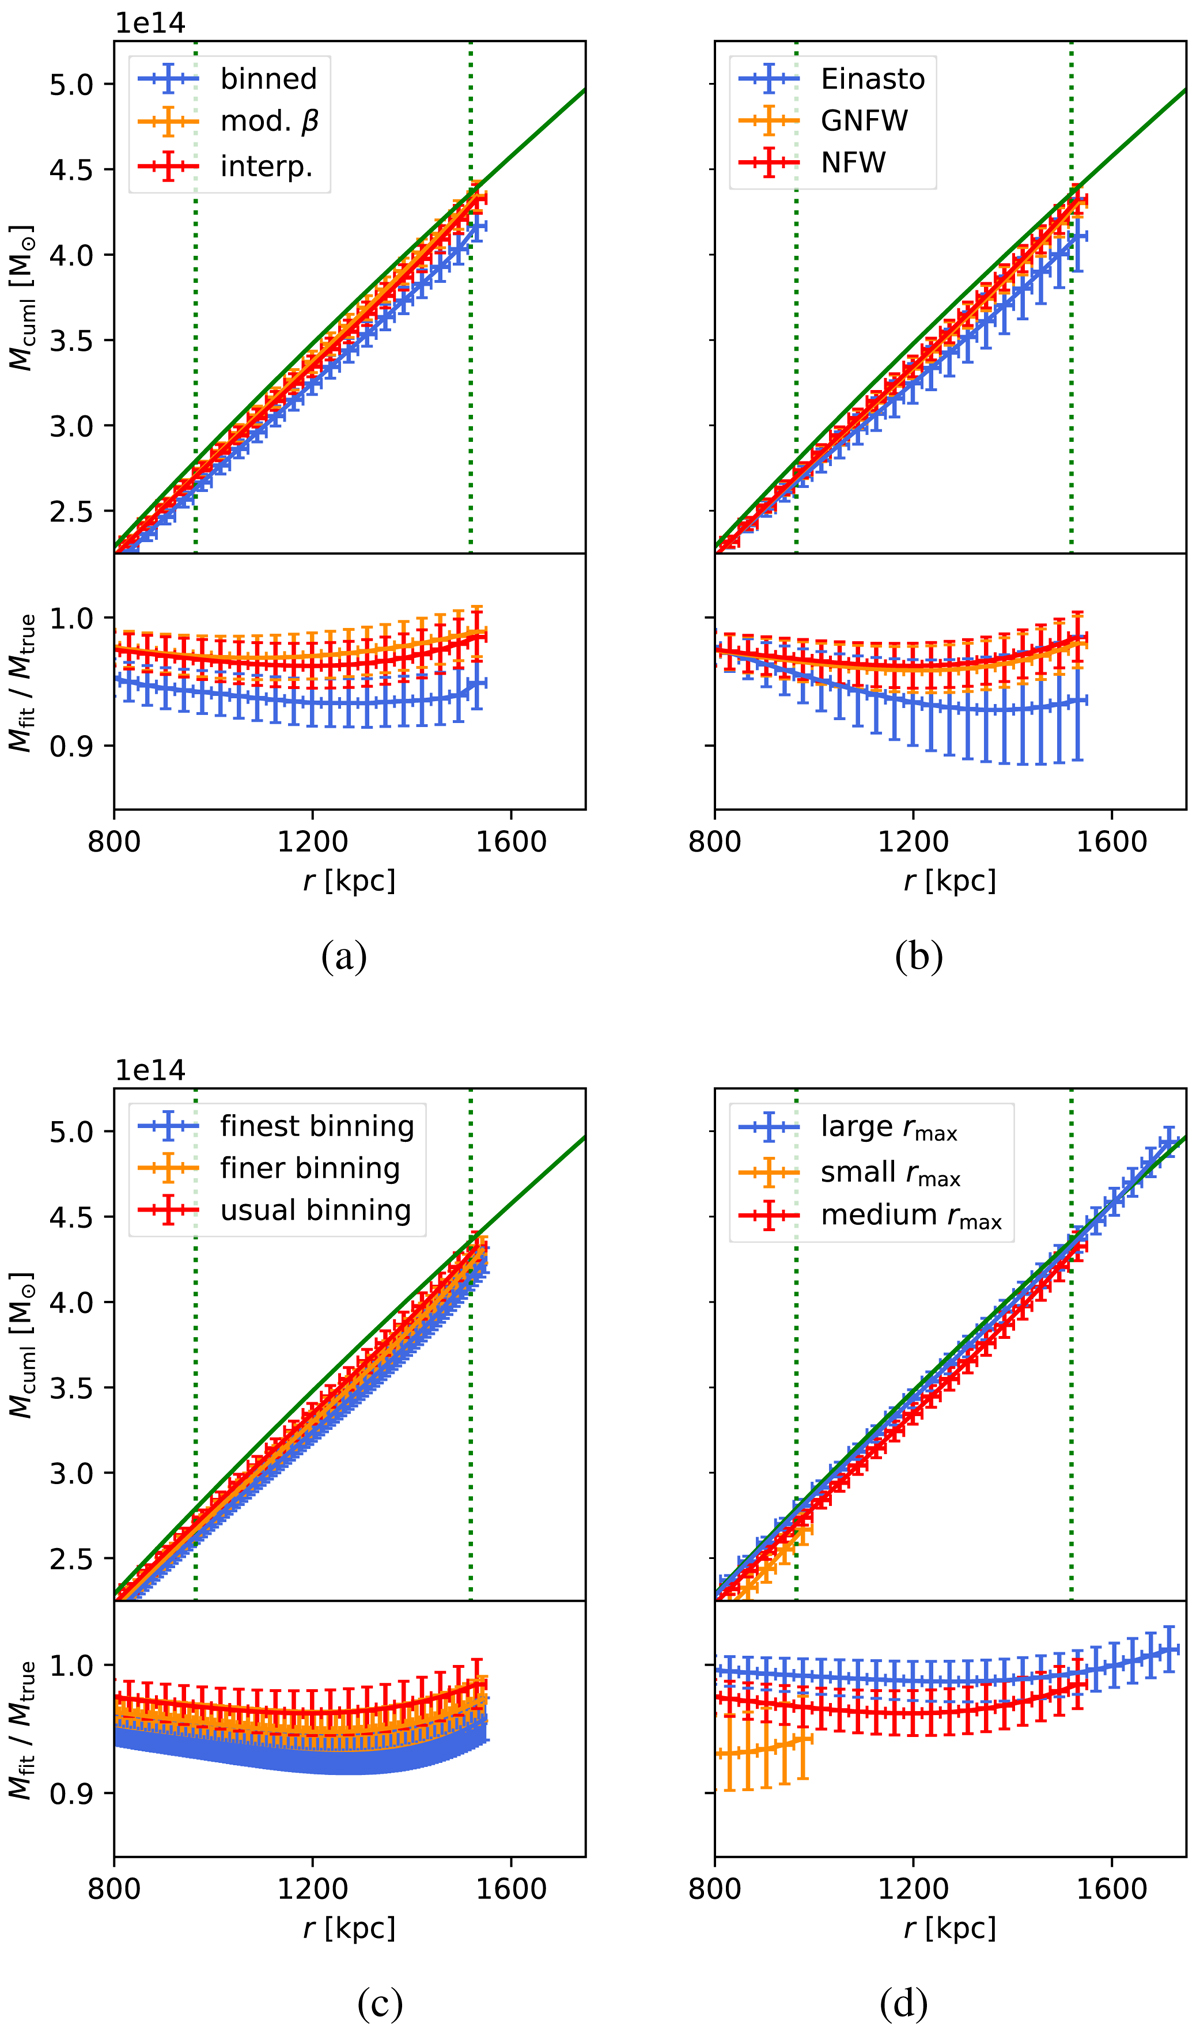
Fig. 1.

Download original image
Ideal clusters. Upper panels: cumulative total mass (calculated as the sum of gas mass and dark matter mass) with different models, binnings, and maximum radii for the cluster fulfilling perfect hydrostatic equilibrium. The green continuous line shows the true profile according to the simulations. The green vertical dotted lines show r500 and r200, which are computed based on the true profiles and the characteristic overdensity of the Universe at the corresponding redshift. The value of r200 is markedly larger than stated in Sect. 2.3, as the gas mass accounts for a considerable part of the total mass for the cluster fulfilling perfect hydrostatic equilibrium. Lower panels: ratio of fitted cumulative total mass and corresponding true mass. (a) different gas density models, (b) different dark matter mass models, (c) different binnings, (d) different maximum radii of the fit.
Current usage metrics show cumulative count of Article Views (full-text article views including HTML views, PDF and ePub downloads, according to the available data) and Abstracts Views on Vision4Press platform.
Data correspond to usage on the plateform after 2015. The current usage metrics is available 48-96 hours after online publication and is updated daily on week days.
Initial download of the metrics may take a while.


