Open Access
Fig. 3.
Download original image
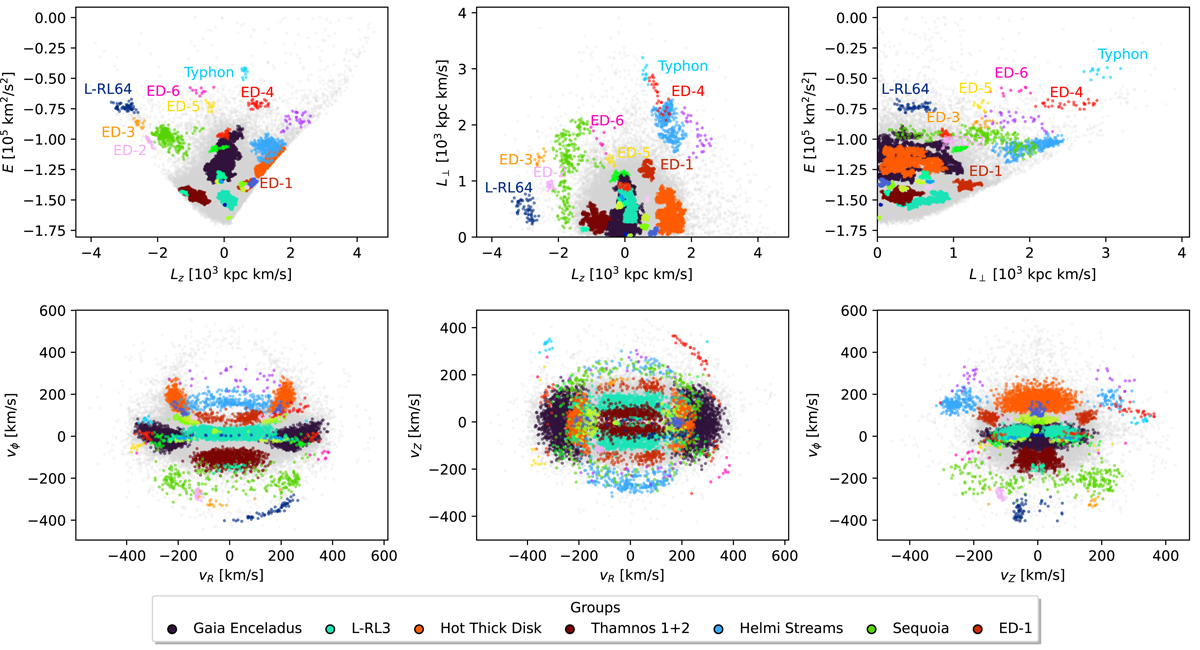
Members of our joined groups and individual clusters, where different colours indicate a star’s association. Stars that are not part of clusters or groups are shown in the background in grey. The top and bottom rows show the IoM and velocity space, respectively.
Current usage metrics show cumulative count of Article Views (full-text article views including HTML views, PDF and ePub downloads, according to the available data) and Abstracts Views on Vision4Press platform.
Data correspond to usage on the plateform after 2015. The current usage metrics is available 48-96 hours after online publication and is updated daily on week days.
Initial download of the metrics may take a while.