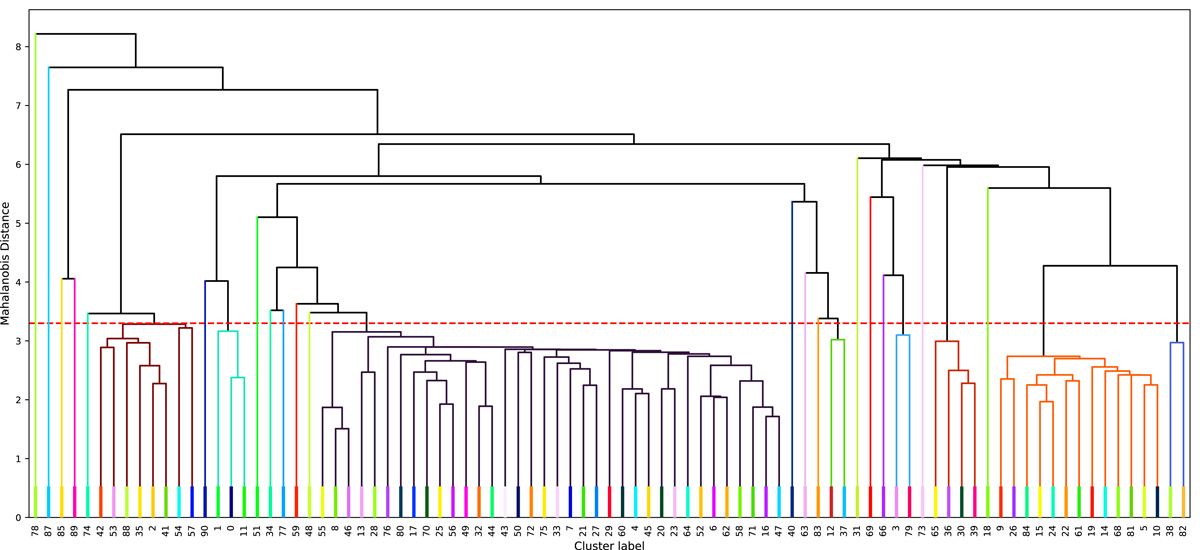
Fig. 2.
Download original image
Relationship in the IoM space between the significant clusters found, shown as a dendrogram using the Mahalanobis distance between the clusters in this space (see main text for details). Using this Mahalanobis distance, the clusters are further joined up to a cut-off threshold (red dashed line) taken to be 3.3. The labels for the clusters are given on the x-axis, and the clusters that are joined to form larger groups have links of the same colour. Using this distance cut, we find 7 preliminary main groups, 1 cluster pair and 19 individual clusters.
Current usage metrics show cumulative count of Article Views (full-text article views including HTML views, PDF and ePub downloads, according to the available data) and Abstracts Views on Vision4Press platform.
Data correspond to usage on the plateform after 2015. The current usage metrics is available 48-96 hours after online publication and is updated daily on week days.
Initial download of the metrics may take a while.