Fig. 3
Download original image
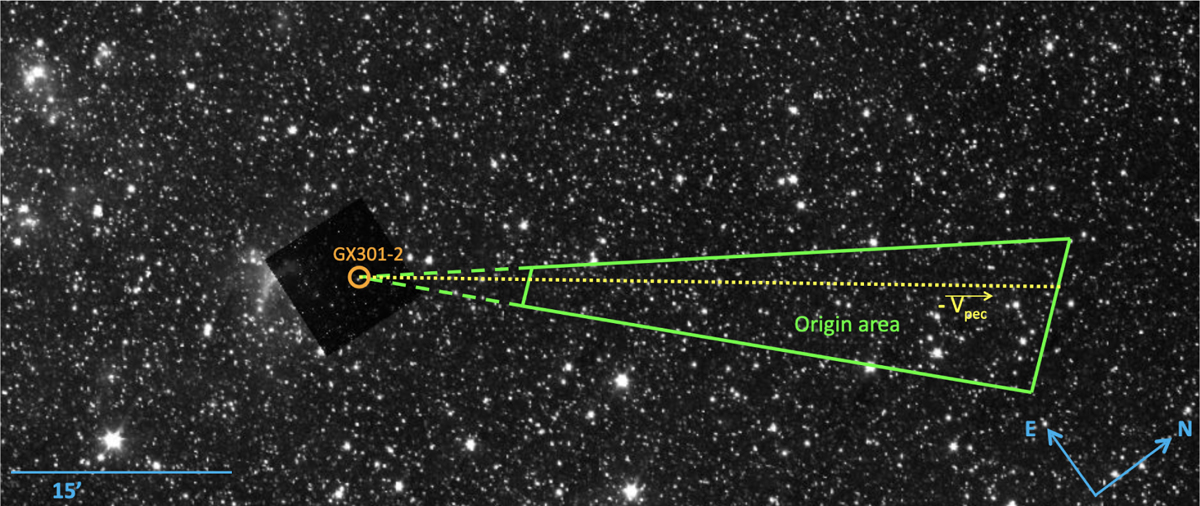
Spitzer image of a wider portion of the sky, containing the original area of GX 301-2. The green polygon is the uncertainty cone for GX 301-2 peculiar velocity, truncated orthogonally to −Vpec so that the supernova event occurred between 250 kyr and 1 Myr. The yellow line is the average line for the trajectory. The HAWK-I image is to scale.
Current usage metrics show cumulative count of Article Views (full-text article views including HTML views, PDF and ePub downloads, according to the available data) and Abstracts Views on Vision4Press platform.
Data correspond to usage on the plateform after 2015. The current usage metrics is available 48-96 hours after online publication and is updated daily on week days.
Initial download of the metrics may take a while.