Fig. 5.
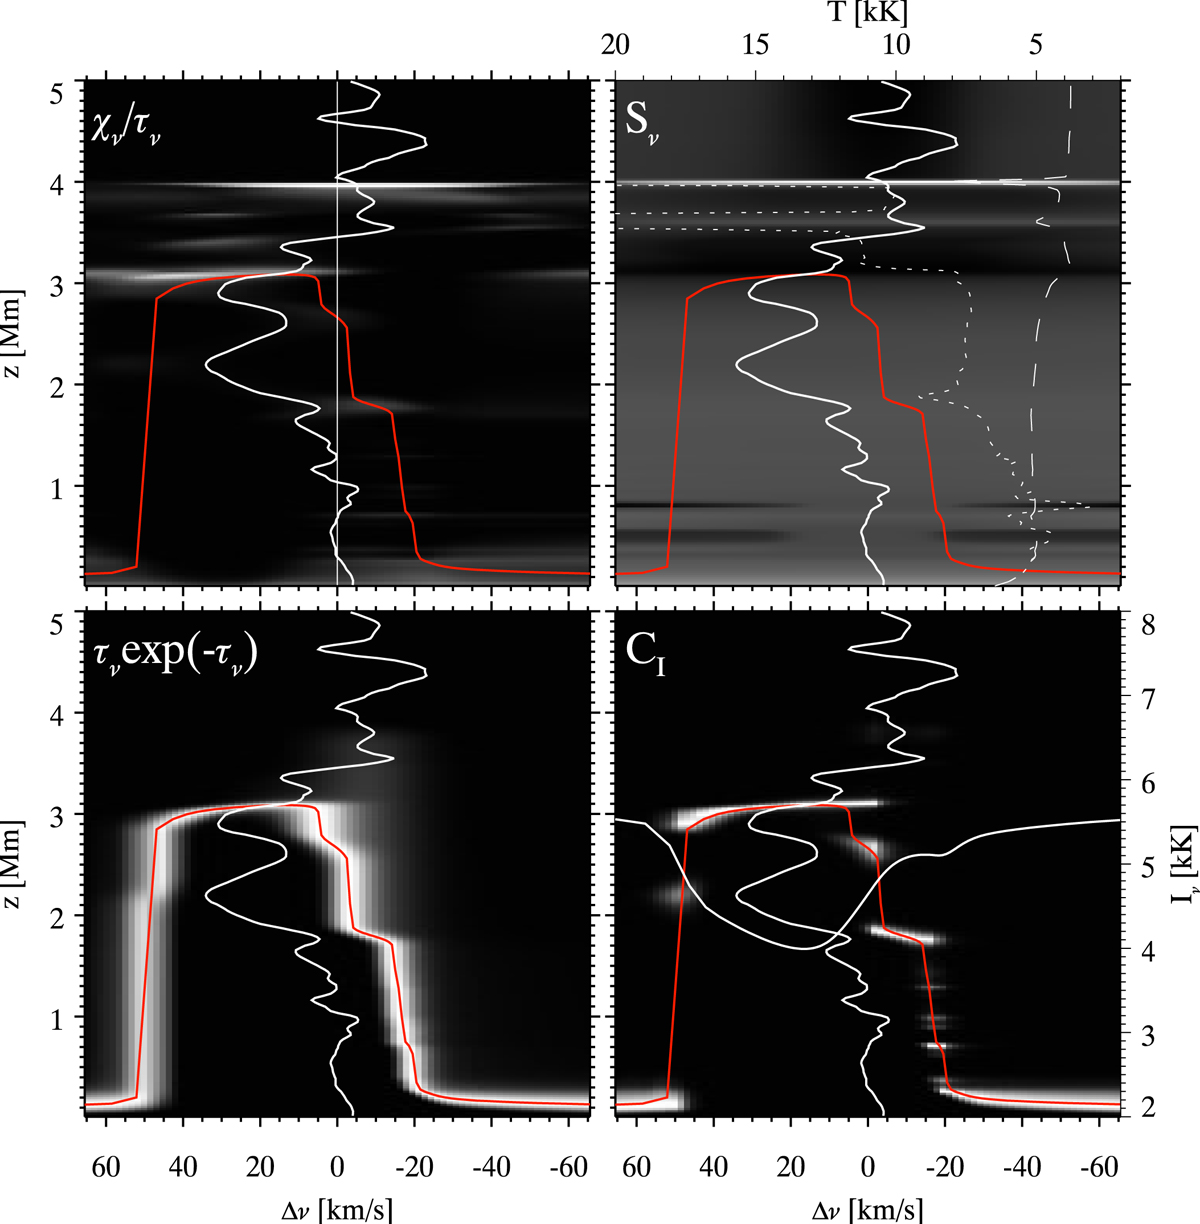
Download original image
Hα four-panel diagram for the RBE at x = 10.7 Mm in Fig. 4. The plotted quantities, as functions of frequency and height, are indicated in the upper-left corner of each subplot and plotted in a grayscale. The vertical component of velocity as a function of height is shown in all panels (solid white line), with upward velocity being positive. The red line marks the τ = 1 position as a function of frequency and height. Planck and total source function are plotted in the upper-right panel with dotted and dashed lines, respectively. The line profile is shown with a solid white line in the lower-right panel.
Current usage metrics show cumulative count of Article Views (full-text article views including HTML views, PDF and ePub downloads, according to the available data) and Abstracts Views on Vision4Press platform.
Data correspond to usage on the plateform after 2015. The current usage metrics is available 48-96 hours after online publication and is updated daily on week days.
Initial download of the metrics may take a while.