Fig. A.1.
Download original image
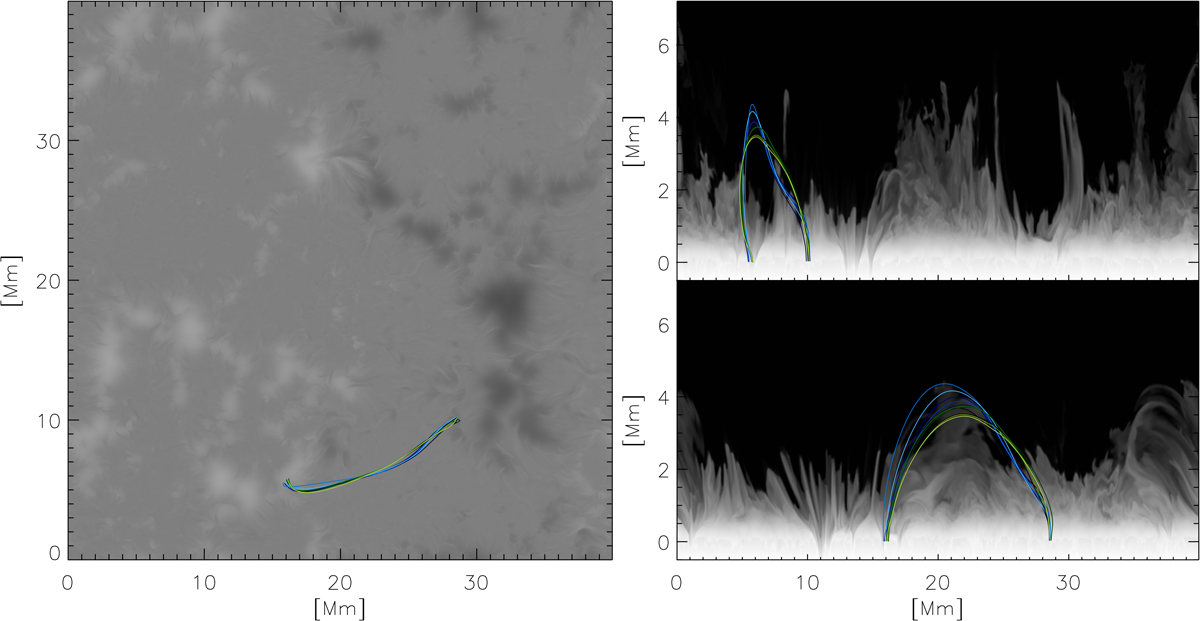
Magnetic field lines traced for the RREs F0 (blue lines) and F1 (green lines). The panel on the left shows the top view with a vertical photospheric magnetic field in the background. Panels on the right show the projection of field lines in x (bottom) and y (top) planes with a density cut at the x,y coordinates of one of the initial seeds.
Current usage metrics show cumulative count of Article Views (full-text article views including HTML views, PDF and ePub downloads, according to the available data) and Abstracts Views on Vision4Press platform.
Data correspond to usage on the plateform after 2015. The current usage metrics is available 48-96 hours after online publication and is updated daily on week days.
Initial download of the metrics may take a while.