Fig. 10.
Download original image
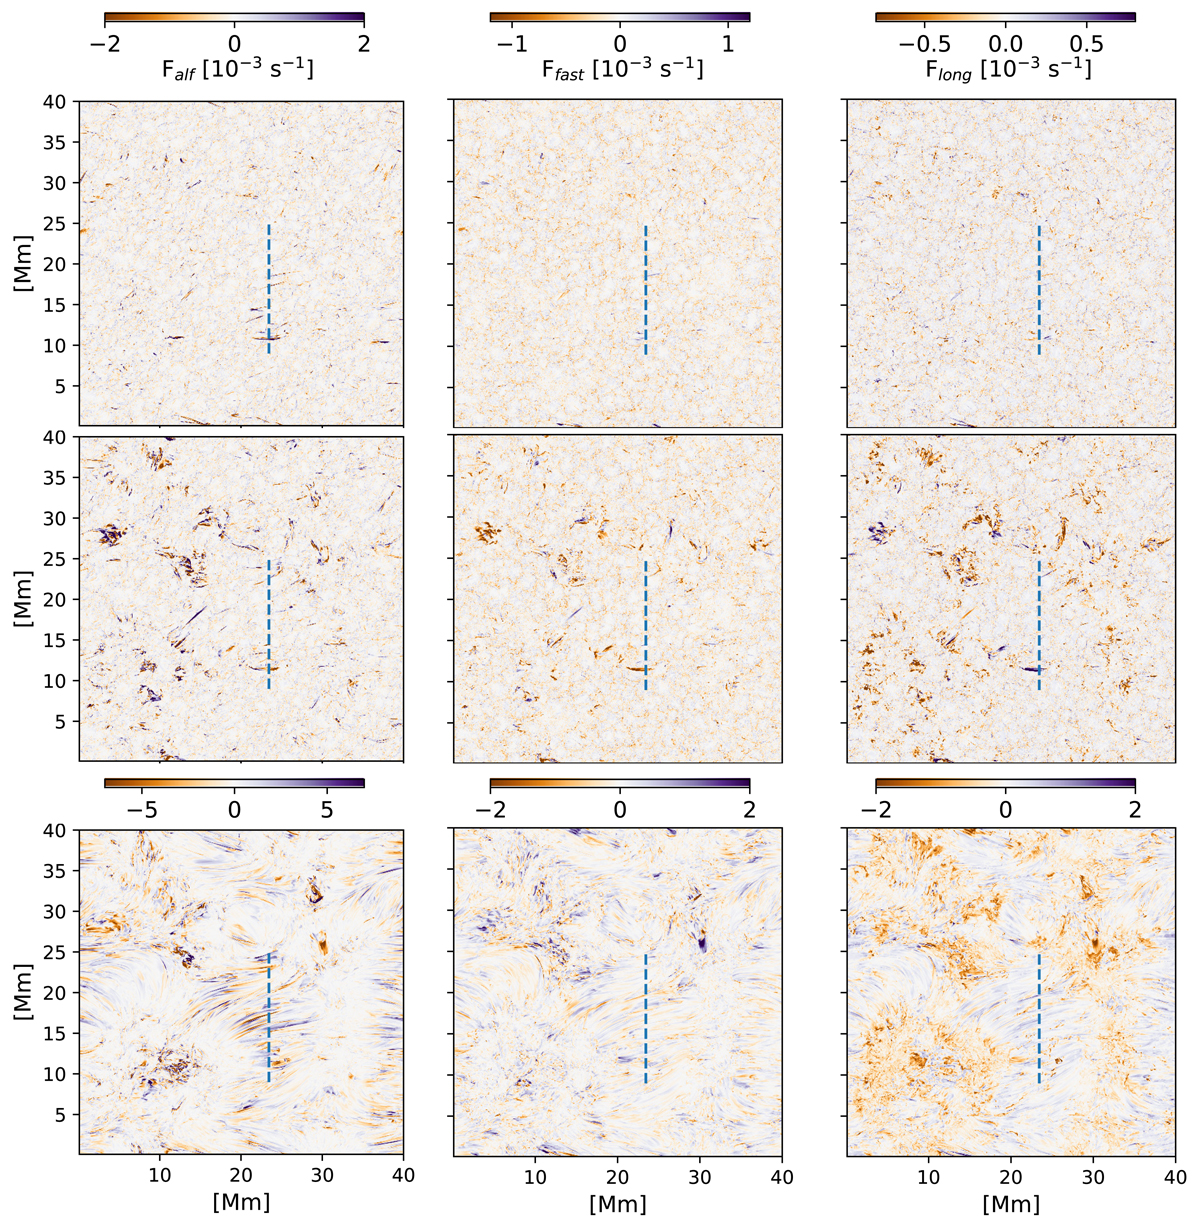
Proxies of different wave modes: Alfvén (left column), fast (middle column), and slow mode waves convolved with the contribution function at different wavelength positions: blue wing at Δv = −36 km s−1 (top row), red wing at Δv = 36 km s−1 (middle row), and nominal line center (bottom row). The blue vertical line marks the position of the cut shown in Fig. 4.
Current usage metrics show cumulative count of Article Views (full-text article views including HTML views, PDF and ePub downloads, according to the available data) and Abstracts Views on Vision4Press platform.
Data correspond to usage on the plateform after 2015. The current usage metrics is available 48-96 hours after online publication and is updated daily on week days.
Initial download of the metrics may take a while.