Open Access
Fig. 8
Download original image
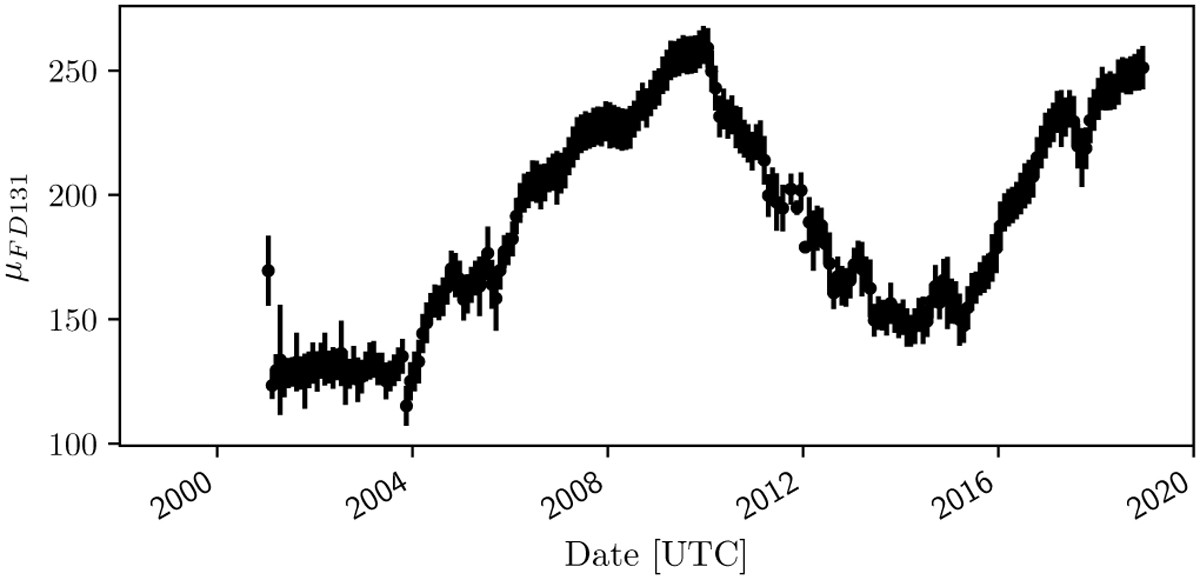
Expectation values μFD131 with standard deviations (as error bars) from Gaussian fits for monthly integrated FD131 values in FF mode. The curve shows a smoothly outlined 11-year modulation without the occurrence of local peaks.
Current usage metrics show cumulative count of Article Views (full-text article views including HTML views, PDF and ePub downloads, according to the available data) and Abstracts Views on Vision4Press platform.
Data correspond to usage on the plateform after 2015. The current usage metrics is available 48-96 hours after online publication and is updated daily on week days.
Initial download of the metrics may take a while.