Fig. 22
Download original image
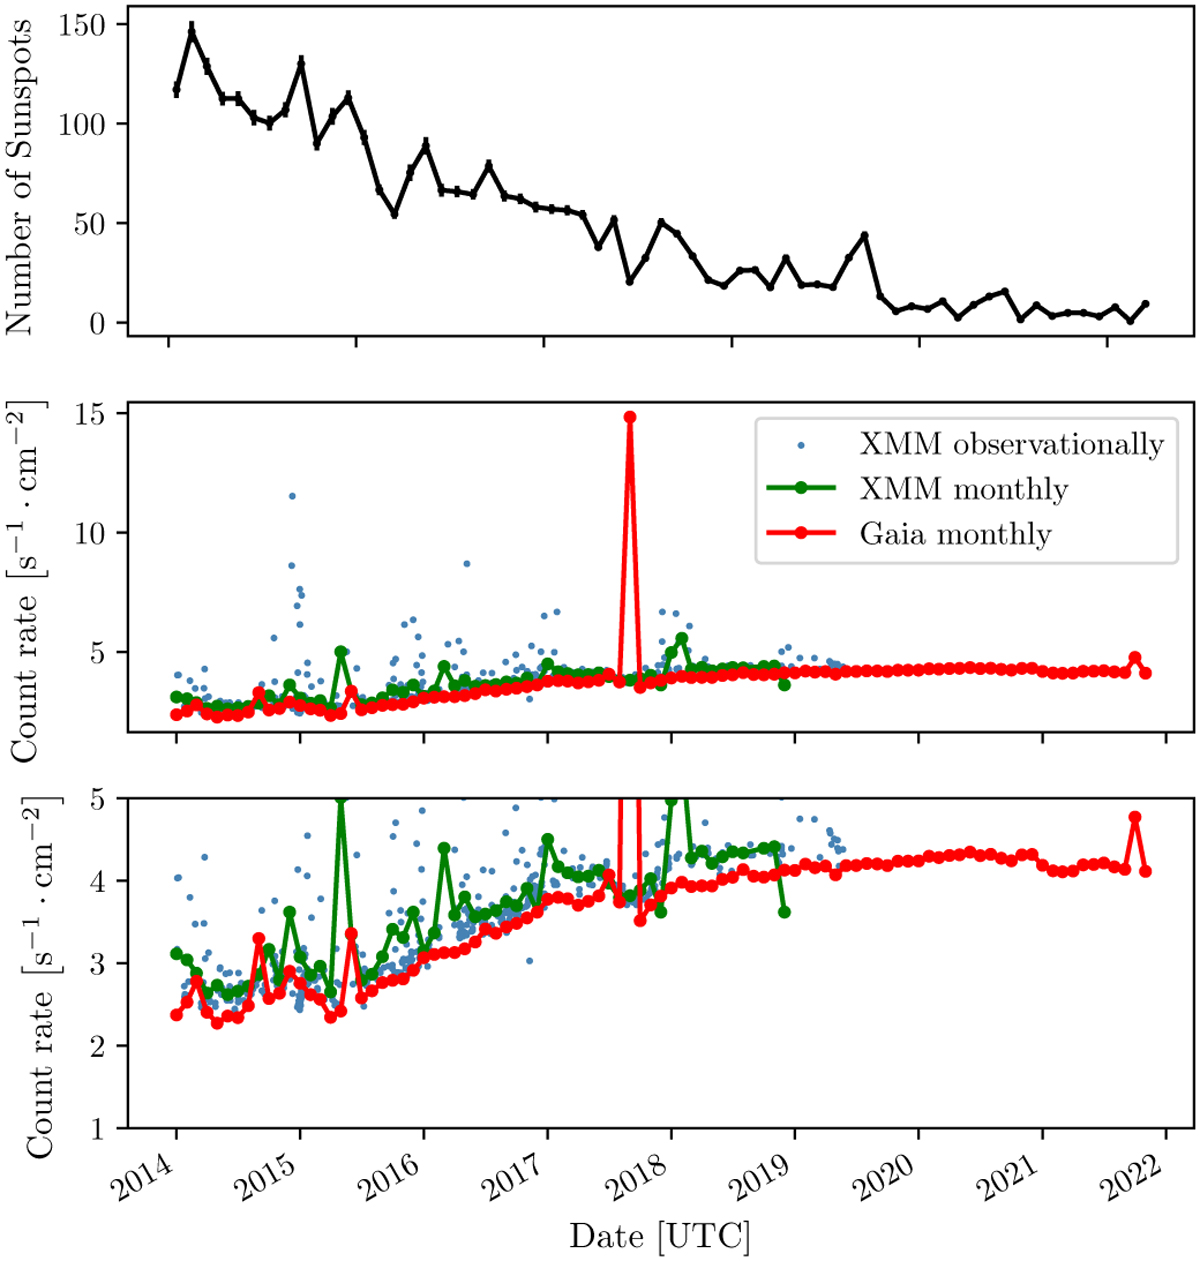
Comparison between solar activity and charged particle rates as observed by XMM-Newton and Gaia. Top: monthly averaged sunspot number; middle: particle count rates measured by Gaia (red), average particle count rates per month (green), and observation measured by XMM-Newton (black); bottom: zoom-in on the low-level region of the middle panel (see Sect. 2).
Current usage metrics show cumulative count of Article Views (full-text article views including HTML views, PDF and ePub downloads, according to the available data) and Abstracts Views on Vision4Press platform.
Data correspond to usage on the plateform after 2015. The current usage metrics is available 48-96 hours after online publication and is updated daily on week days.
Initial download of the metrics may take a while.