Fig. 21
Download original image
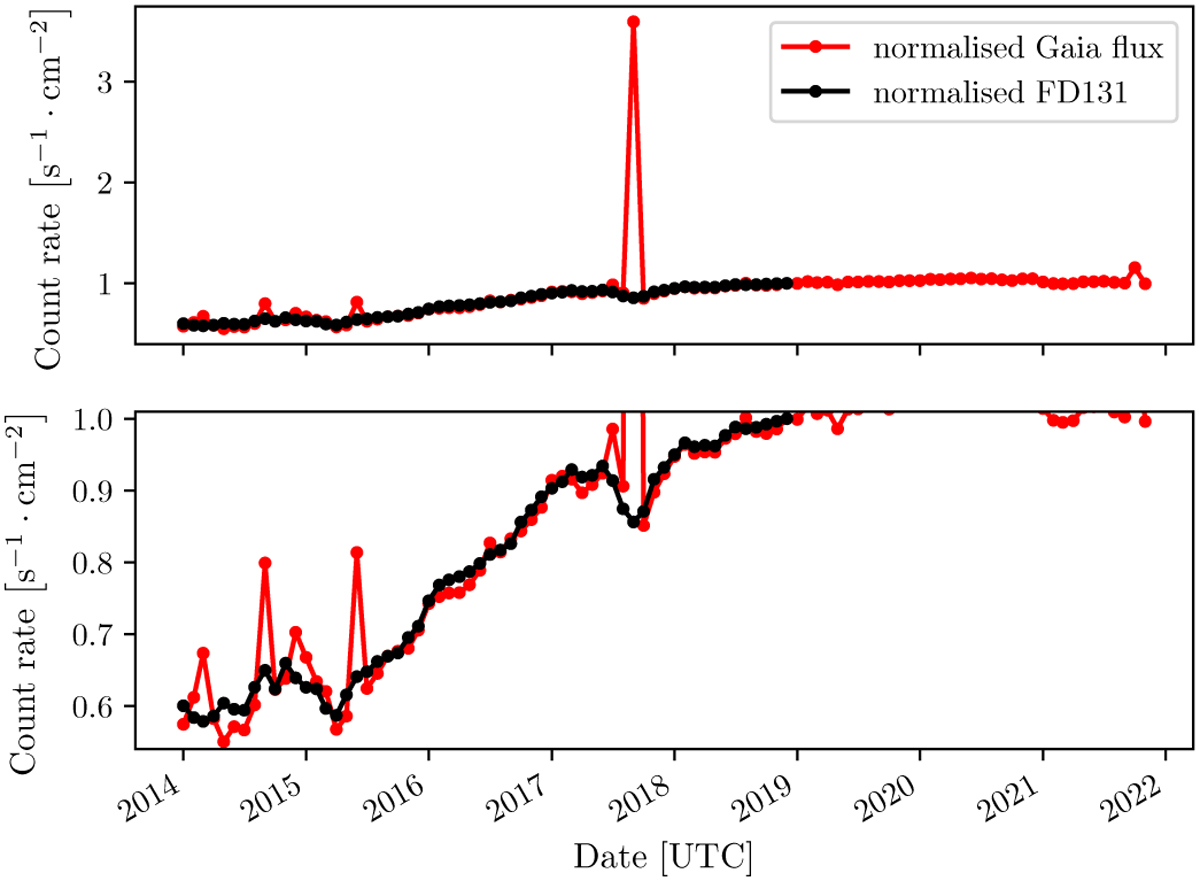
Comparison between monthly averaged particle count rates measured by Gaia and FF mode FD131 values for XMM-Newton. Measures were normalised to their respective values on December 2018. Both curves show the same overall behaviour (top). Exceptional points can be observed in September 2017, June 2015, and September 2014 (bottom), which are related to SEP events (Cohen & Mewalt 2019).
Current usage metrics show cumulative count of Article Views (full-text article views including HTML views, PDF and ePub downloads, according to the available data) and Abstracts Views on Vision4Press platform.
Data correspond to usage on the plateform after 2015. The current usage metrics is available 48-96 hours after online publication and is updated daily on week days.
Initial download of the metrics may take a while.