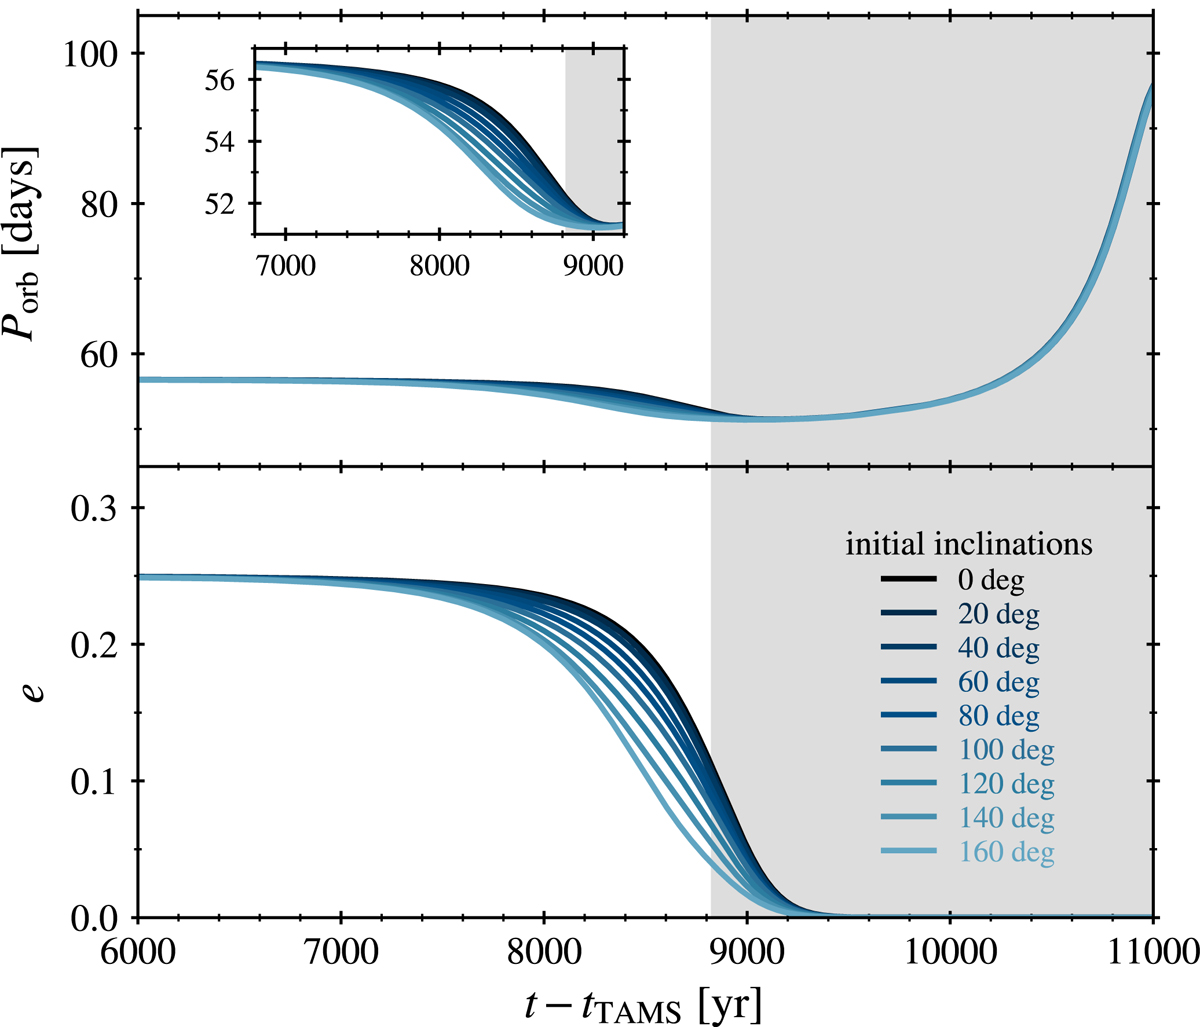
Fig. 4.
Download original image
Same parameter evolutions as in Fig. 2, but the time axis starts just after the end of the MS. The evolution of these parameters before ∼6000 yr after reaching the end of the MS is the same in all the different inclination cases. In the zoomed-in region the small differences present in Porb just before the beginning of the MT phase are shown. The grey region indicates the MT phase.
Current usage metrics show cumulative count of Article Views (full-text article views including HTML views, PDF and ePub downloads, according to the available data) and Abstracts Views on Vision4Press platform.
Data correspond to usage on the plateform after 2015. The current usage metrics is available 48-96 hours after online publication and is updated daily on week days.
Initial download of the metrics may take a while.