Fig. 6.
Download original image
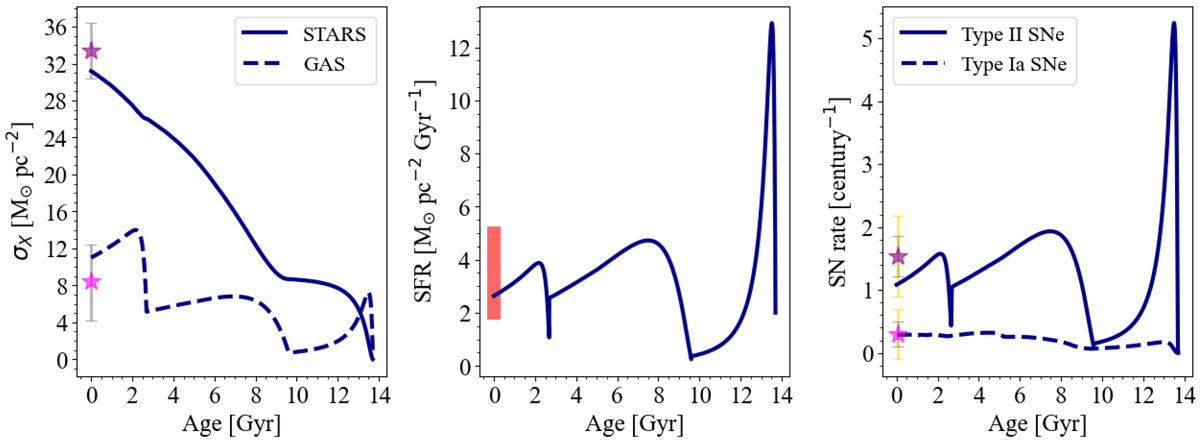
Galactic disc observables. Left panel: surface mass density evolution of stars (σ⋆, solid blue line) and gas (σg, dashed blue line) predicted by the three-infall chemical evolution model presented in this study with model parameters reported in Table 1. The purple star indicates the observed present-day σ⋆ value given by McKee et al. (2015). The magenta star represents the present-day σg value averaging between the Dame (1993) and Nakanishi & Sofue (2003, 2006) dataset as presented by Palla et al. (2020) (here shown only at 8 kpc). Middle panel: the SFR time evolution predicted by the model is reported with the blue line. The red shaded area indicates the measured range in the solar annulus suggested by Prantzos et al. (2018). Right panel: evolution of the Type Ia SN (dashed line) and Type II SN (solid line) rates predicted by model for whole Galactic disc. The magenta star stands for the observed Type Ia SN rate observed by Cappellaro & Turatto (1997), whereas the purple one stands for Type II SN rates observed by Li et al. (2011). The 1σ and 2σ errors are reported with grey and yellow bars, respectively.
Current usage metrics show cumulative count of Article Views (full-text article views including HTML views, PDF and ePub downloads, according to the available data) and Abstracts Views on Vision4Press platform.
Data correspond to usage on the plateform after 2015. The current usage metrics is available 48-96 hours after online publication and is updated daily on week days.
Initial download of the metrics may take a while.