Fig. 5.
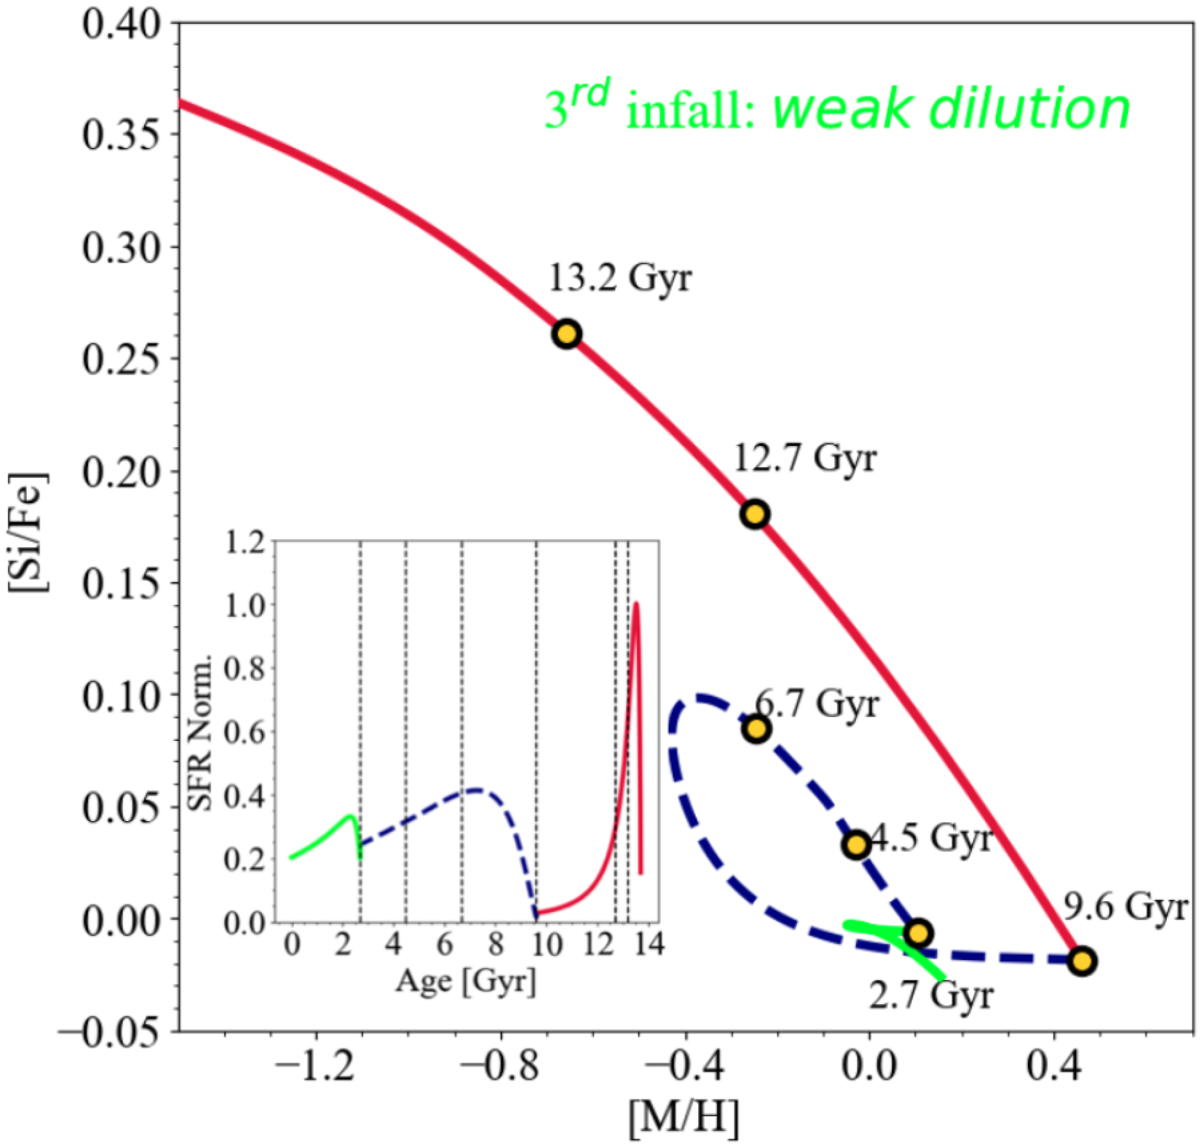
Download original image
Same as in Fig. 3 but considering a smaller gas infall mass for the third infall – it accounts for 15% of the total low-α sequence barionic mass – and a larger SFE (ν3 = 0.8 Gyr−1). The inset also reports the normalised star formation history with the different evolutionary phases coloured as in the main plot [Si/Fe] versus [M/H]. The value of the SFE associated to the low-α phase I (indicated with the blue dashed line) is ν2 = 1 Gyr−1. Vertical dashed lines indicate the ages corresponding to yellow points.
Current usage metrics show cumulative count of Article Views (full-text article views including HTML views, PDF and ePub downloads, according to the available data) and Abstracts Views on Vision4Press platform.
Data correspond to usage on the plateform after 2015. The current usage metrics is available 48-96 hours after online publication and is updated daily on week days.
Initial download of the metrics may take a while.