Fig. 3.
Download original image
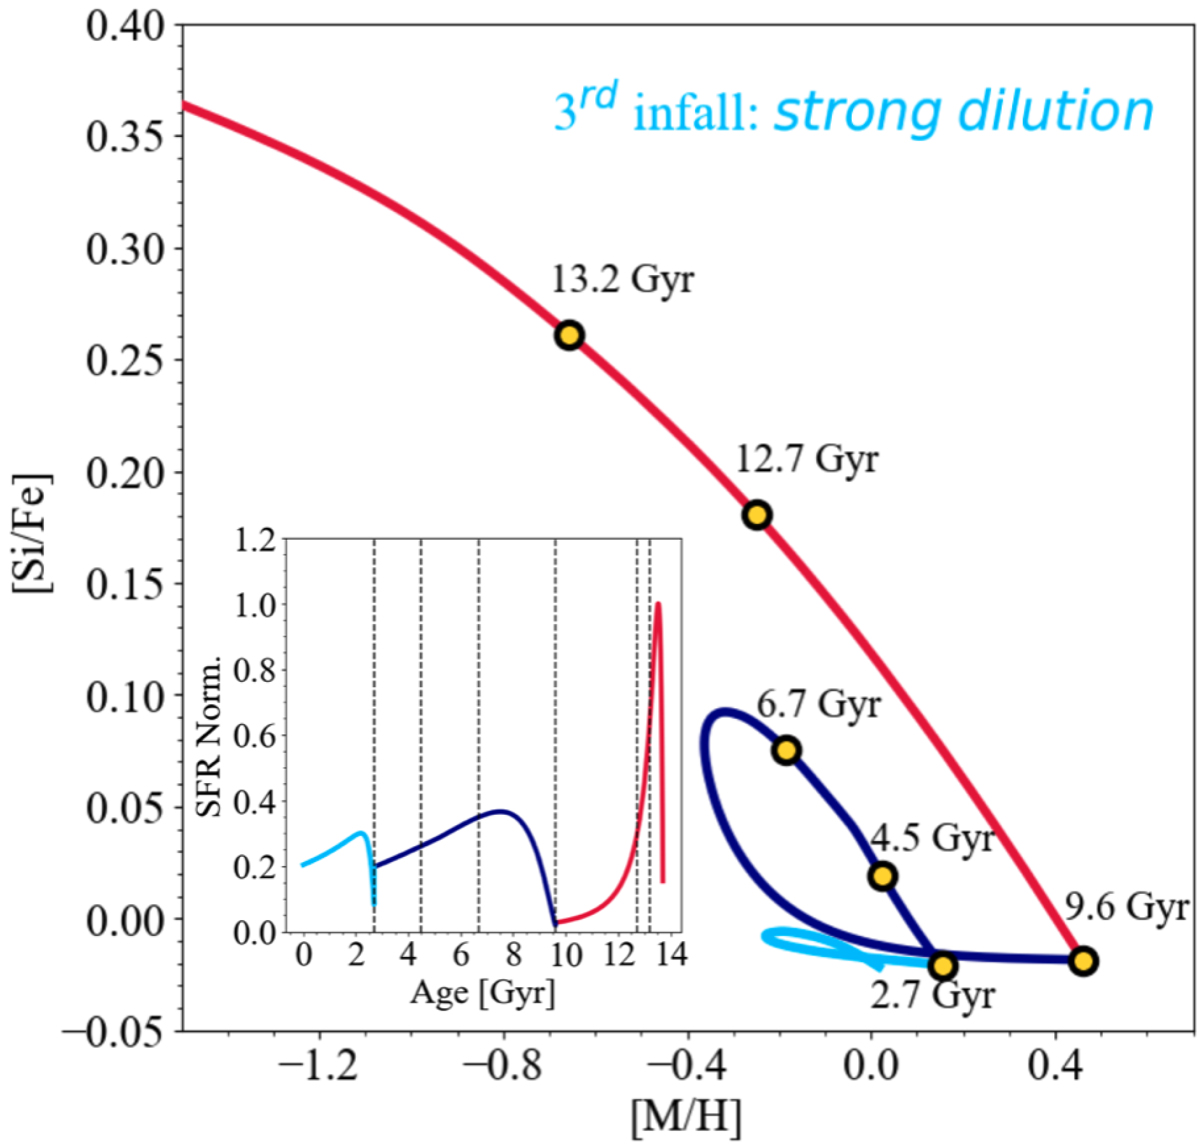
Abundance ratios of [Si/Fe] as a function of [M/H] predicted by the three-infall chemical evolution model presented in Sect. 3 and with parameters listed in Table 1. Different colours indicate the distinct infall episodes: red (high-α), dark blue (low-α, part I), and light-blue (low-α, part II). Filled yellow circles indicate the abundance ratios of the chemical evolution model at the given age. In the inset, the normalised star formation history is reported with the different evolutionary phases coloured, as in main plot [Si/Fe] versus [M/H]. The vertical dashed lines indicate the ages corresponding to yellow points.
Current usage metrics show cumulative count of Article Views (full-text article views including HTML views, PDF and ePub downloads, according to the available data) and Abstracts Views on Vision4Press platform.
Data correspond to usage on the plateform after 2015. The current usage metrics is available 48-96 hours after online publication and is updated daily on week days.
Initial download of the metrics may take a while.