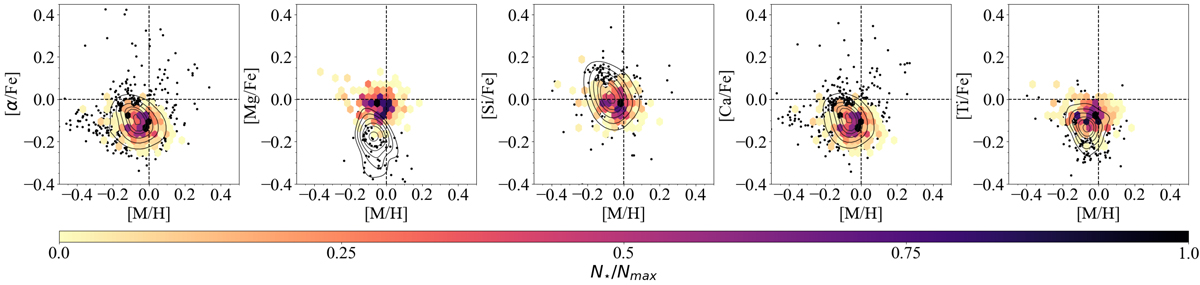
Fig. 12.
Download original image
Comparison between abundance ratios of [α/Fe], [Mg/Fe], [Si/Fe], [Ca/Fe], [Ti/Fe] as a function of [M/H] predicted by the three-infall model for stars younger than 1 Gyr compared and Gaia DR 3 massive stars. Black points indicate observed massive stars selected by Gaia Collaboration (2023b, see text for details) using the calibrations proposed by Recio-Blanco et al. (2023). The contour lines enclose fractions of 0.75, 0.60, 0.45, 0.30,0.20, and 0.05 of the total number of observed stars. The colour-coded hexagons indicate the model predictions and highlight the total number of stars formed by the fiducial three-infall model in the different regions of the abundance ratio relation.
Current usage metrics show cumulative count of Article Views (full-text article views including HTML views, PDF and ePub downloads, according to the available data) and Abstracts Views on Vision4Press platform.
Data correspond to usage on the plateform after 2015. The current usage metrics is available 48-96 hours after online publication and is updated daily on week days.
Initial download of the metrics may take a while.